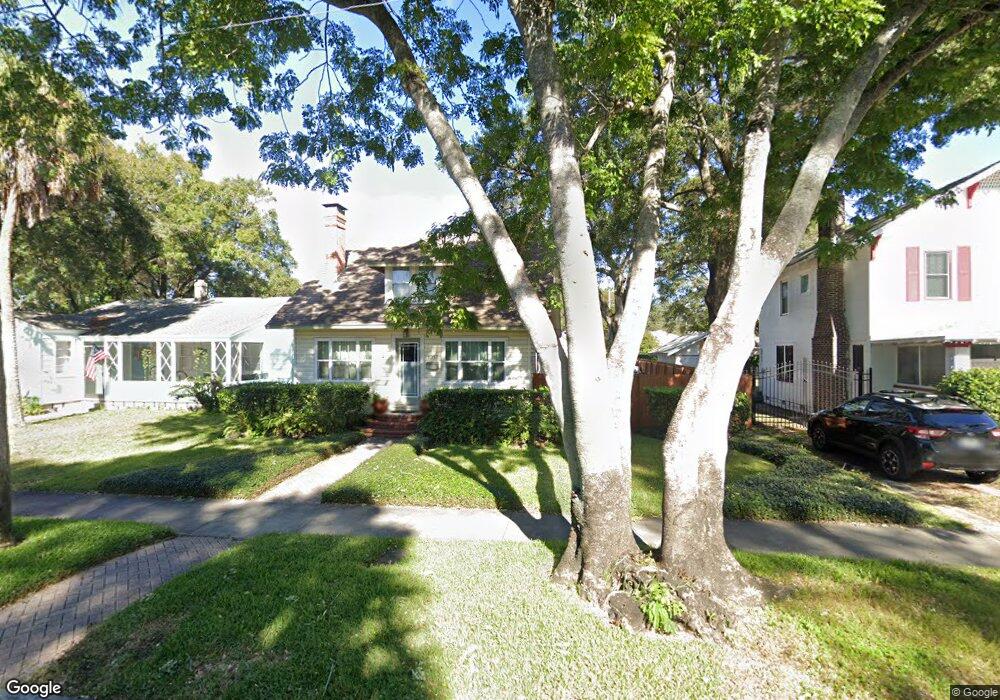
1057 21st Ave N Saint Petersburg, FL 33704
Euclid-Saint Paul NeighborhoodEstimated Value: $546,000 - $658,000
--
Bed
--
Bath
1,118
Sq Ft
$537/Sq Ft
Est. Value
About This Home
This home is located at 1057 21st Ave N, Saint Petersburg, FL 33704 and is currently estimated at $600,724, approximately $537 per square foot. 1057 21st Ave N is a home located in Pinellas County with nearby schools including Woodlawn Elementary School, John Hopkins Middle School, and St. Petersburg High School.
Ownership History
Date
Name
Owned For
Owner Type
Purchase Details
Closed on
Sep 17, 2020
Sold by
Jones Gary and Jones Jennifer
Bought by
Phelan Matthew William and Smith Maria
Current Estimated Value
Home Financials for this Owner
Home Financials are based on the most recent Mortgage that was taken out on this home.
Original Mortgage
$359,100
Outstanding Balance
$318,086
Interest Rate
2.8%
Mortgage Type
New Conventional
Estimated Equity
$282,638
Purchase Details
Closed on
Mar 1, 2018
Sold by
Albert P Charley
Bought by
Jones Gary and Jones Jennifer
Home Financials for this Owner
Home Financials are based on the most recent Mortgage that was taken out on this home.
Original Mortgage
$135,000
Interest Rate
4.43%
Purchase Details
Closed on
Feb 12, 2001
Sold by
Judge Eric S and Judge Natalie C
Bought by
One Gary J and One Jennifer
Purchase Details
Closed on
Jul 14, 1997
Sold by
Turtle Milangela S and Turtle Jessie A
Bought by
Wetherington Eric S and Judge Natalie C
Create a Home Valuation Report for This Property
The Home Valuation Report is an in-depth analysis detailing your home's value as well as a comparison with similar homes in the area
Home Values in the Area
Average Home Value in this Area
Purchase History
| Date | Buyer | Sale Price | Title Company |
|---|---|---|---|
| Phelan Matthew William | $399,000 | Cappa Title Inc | |
| Jones Gary | -- | -- | |
| One Gary J | $135,200 | -- | |
| Wetherington Eric S | $87,500 | -- |
Source: Public Records
Mortgage History
| Date | Status | Borrower | Loan Amount |
|---|---|---|---|
| Open | Phelan Matthew William | $359,100 | |
| Previous Owner | Wetherington Eric S | $135,000 | |
| Previous Owner | Wetherington Eric S | -- | |
| Previous Owner | Wetherington Eric S | $40,500 | |
| Previous Owner | Wetherington Eric S | $125,035 |
Source: Public Records
Tax History Compared to Growth
Tax History
| Year | Tax Paid | Tax Assessment Tax Assessment Total Assessment is a certain percentage of the fair market value that is determined by local assessors to be the total taxable value of land and additions on the property. | Land | Improvement |
|---|---|---|---|---|
| 2024 | $6,326 | $371,926 | -- | -- |
| 2023 | $6,326 | $361,093 | $0 | $0 |
| 2022 | $6,170 | $350,576 | $0 | $0 |
| 2021 | $6,262 | $340,365 | $0 | $0 |
| 2020 | $1,363 | $106,229 | $0 | $0 |
| 2019 | $1,325 | $103,841 | $0 | $0 |
| 2018 | $1,295 | $101,905 | $0 | $0 |
| 2017 | $1,272 | $99,809 | $0 | $0 |
| 2016 | $1,249 | $97,756 | $0 | $0 |
| 2015 | $1,267 | $97,076 | $0 | $0 |
| 2014 | $1,255 | $96,306 | $0 | $0 |
Source: Public Records
Map
Nearby Homes
- 934 21st Ave N
- 939 19th Ave N
- 1040 19th Ave N
- 1829 10th St N
- 1120 19th Ave N
- 921 24th Ave N
- 859 23rd Ave N
- 1925 8th St N
- 1146 17th Ave N
- 785 23rd Ave N
- 925 16th Ave N
- 1326 17th Terrace N
- 1042 16th Ave N
- 1211 16th Ave N
- 920 16th Ave N
- 1521 21st Ave N
- 1530 21st Ave N
- 2621 13th St N
- 727 23rd Ave N
- 1435 17th Ave N
- 1069 Avenue N
- 1049 21st Ave N
- 1069 21st Ave N Unit B
- 1069 21st Ave N
- 1045 21st Ave N
- 1075 21st Ave N
- 1040 21st Ave N
- 1085 21st Ave N
- 1060 22nd Ave N
- 1066 22nd Ave N
- 1050 22nd Ave N
- 1009 21st Ave N
- 1074 22nd Ave N
- 1044 22nd Ave N
- 1095 21st Ave N
- 1050 21st Ave N
- 1080 22nd Ave N
- 1007 21st Ave N
- 1056 21st Ave N
- 1032 22nd Ave N