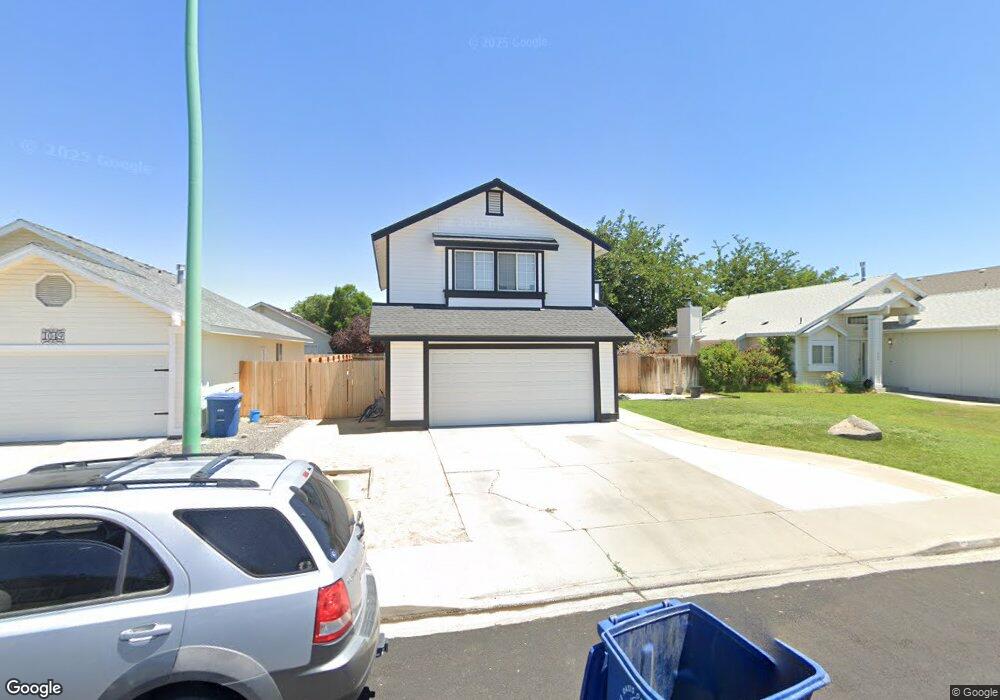
1057 Andrew Ln Fallon, NV 89406
Estimated Value: $330,000 - $350,000
3
Beds
3
Baths
1,476
Sq Ft
$228/Sq Ft
Est. Value
About This Home
This home is located at 1057 Andrew Ln, Fallon, NV 89406 and is currently estimated at $336,910, approximately $228 per square foot. 1057 Andrew Ln is a home located in Churchill County with nearby schools including Lahontan Elementary School, E.C. Best Elementary School, and Numa Elementary School.
Ownership History
Date
Name
Owned For
Owner Type
Purchase Details
Closed on
Jul 5, 2007
Sold by
Coverston Yates Kendi and Yates Kenneth C
Bought by
Coverston Chad A
Current Estimated Value
Home Financials for this Owner
Home Financials are based on the most recent Mortgage that was taken out on this home.
Original Mortgage
$148,000
Outstanding Balance
$91,826
Interest Rate
6.36%
Mortgage Type
Purchase Money Mortgage
Estimated Equity
$245,084
Purchase Details
Closed on
May 21, 2007
Sold by
Coverston Yates Kendi
Bought by
Coverston Yates Kendi and Coverston Chad A
Home Financials for this Owner
Home Financials are based on the most recent Mortgage that was taken out on this home.
Original Mortgage
$148,000
Outstanding Balance
$91,826
Interest Rate
6.36%
Mortgage Type
Purchase Money Mortgage
Estimated Equity
$245,084
Create a Home Valuation Report for This Property
The Home Valuation Report is an in-depth analysis detailing your home's value as well as a comparison with similar homes in the area
Home Values in the Area
Average Home Value in this Area
Purchase History
| Date | Buyer | Sale Price | Title Company |
|---|---|---|---|
| Coverston Chad A | $74,000 | Stewart Title Company | |
| Coverston Yates Kendi | -- | None Available | |
| Coverston Yates Kendi | -- | None Available |
Source: Public Records
Mortgage History
| Date | Status | Borrower | Loan Amount |
|---|---|---|---|
| Open | Coverston Chad A | $148,000 |
Source: Public Records
Tax History
| Year | Tax Paid | Tax Assessment Tax Assessment Total Assessment is a certain percentage of the fair market value that is determined by local assessors to be the total taxable value of land and additions on the property. | Land | Improvement |
|---|---|---|---|---|
| 2025 | $1,932 | $64,302 | $21,700 | $42,602 |
| 2024 | $1,932 | $63,187 | $19,950 | $43,237 |
| 2023 | $1,932 | $60,852 | $19,950 | $40,902 |
| 2022 | $1,656 | $47,896 | $12,250 | $35,646 |
| 2021 | $1,533 | $44,971 | $12,250 | $32,721 |
| 2020 | $1,477 | $44,121 | $10,500 | $33,621 |
| 2019 | $1,434 | $43,502 | $10,500 | $33,002 |
| 2018 | $1,369 | $42,912 | $10,500 | $32,412 |
| 2017 | $1,328 | $39,622 | $7,000 | $32,622 |
| 2016 | $1,295 | $36,695 | $7,000 | $29,695 |
| 2015 | $1,270 | $33,465 | $7,000 | $26,465 |
| 2014 | $1,230 | $32,495 | $8,225 | $24,270 |
Source: Public Records
Map
Nearby Homes
- 1009 Deena Way
- 595 Cora Way
- 1291 S Taylor St
- 1091 Tiffany Dr
- 475 S Bailey St
- 360 & 360 1/2 W Virginia St
- 1.55 Acres on S Maine St
- 1205 S Maine St Unit 20
- 1205 S Maine St Unit 21
- 1205 S Maine St Unit 18
- 250 S Taylor St
- 687 Douglas St
- 301 Tolas Place Unit 8
- 290 Ferguson St
- 361 Silver Spur Dr Unit 181155
- 126 S Laverne St
- 628 Humboldt St
- 650 Mc Lean St
- 845 Mc Lean St
- 009-291-74 00929174
- 1065 Andrew Ln Unit 1
- 1065 Andrew Ln
- 1049 Andrew Ln
- 1041 Andrew Ln
- 1073 Andrew Ln
- 1056 Deena Way Unit 3
- 1064 Deena Way
- 1048 Deena Way
- 1040 Andrew Ln
- 1030 Andrew Ln
- 1050 Andrew Ln Unit 2
- 1072 Deena Way
- 1040 Deena Way
- 1033 Andrew Ln
- 1081 Andrew Ln
- 1060 Andrew Ln
- 1080 Deena Way
- 1020 Andrew Ln
- 1070 Andrew Ln
- 1089 Andrew Ln
Your Personal Tour Guide
Ask me questions while you tour the home.