1057 Blacks Hollow Rd Apollo, PA 15613
Kiskiminetas Township NeighborhoodEstimated Value: $260,387 - $320,000
2
Beds
1
Bath
2,024
Sq Ft
$139/Sq Ft
Est. Value
About This Home
This home is located at 1057 Blacks Hollow Rd, Apollo, PA 15613 and is currently estimated at $280,347, approximately $138 per square foot. 1057 Blacks Hollow Rd is a home located in Armstrong County with nearby schools including Apollo-Ridge Elementary School, Apollo-Ridge Middle School, and Apollo-Ridge High School.
Ownership History
Date
Name
Owned For
Owner Type
Purchase Details
Closed on
Aug 8, 2024
Sold by
Penrod Randy and Penrod Joann
Bought by
Penrod Jeremy L and Penrod Alexandria L
Current Estimated Value
Purchase Details
Closed on
Jan 24, 2019
Sold by
Endress Matthew C and Endress Kimberly C
Bought by
Penrod Randy and Penrod Joann
Purchase Details
Closed on
Aug 17, 2011
Sold by
Kennedy Eric and Kennedy Eric W
Bought by
Endress Matthew C and Endress Kimberley C
Home Financials for this Owner
Home Financials are based on the most recent Mortgage that was taken out on this home.
Original Mortgage
$1,128,150
Interest Rate
4.62%
Mortgage Type
New Conventional
Purchase Details
Closed on
Feb 9, 2006
Sold by
Russo Daniel R
Bought by
Kennedy Eric and Holmes Lauren L
Home Financials for this Owner
Home Financials are based on the most recent Mortgage that was taken out on this home.
Original Mortgage
$39,089
Interest Rate
6.23%
Mortgage Type
FHA
Purchase Details
Closed on
Nov 5, 1986
Create a Home Valuation Report for This Property
The Home Valuation Report is an in-depth analysis detailing your home's value as well as a comparison with similar homes in the area
Home Values in the Area
Average Home Value in this Area
Purchase History
| Date | Buyer | Sale Price | Title Company |
|---|---|---|---|
| Penrod Jeremy L | -- | None Listed On Document | |
| Penrod Randy | $64,000 | None Available | |
| Endress Matthew C | $109,000 | None Available | |
| Kennedy Eric | $39,000 | None Available | |
| -- | $2,000 | -- |
Source: Public Records
Mortgage History
| Date | Status | Borrower | Loan Amount |
|---|---|---|---|
| Previous Owner | Endress Matthew C | $1,128,150 | |
| Previous Owner | Kennedy Eric | $39,089 |
Source: Public Records
Tax History Compared to Growth
Tax History
| Year | Tax Paid | Tax Assessment Tax Assessment Total Assessment is a certain percentage of the fair market value that is determined by local assessors to be the total taxable value of land and additions on the property. | Land | Improvement |
|---|---|---|---|---|
| 2025 | $5,232 | $54,660 | $31,510 | $23,150 |
| 2024 | $4,859 | $54,660 | $31,510 | $23,150 |
| 2023 | $3,980 | $54,660 | $31,510 | $23,150 |
| 2022 | $3,935 | $54,660 | $31,510 | $23,150 |
| 2021 | $3,867 | $54,660 | $31,510 | $23,150 |
| 2020 | $3,867 | $54,660 | $31,510 | $23,150 |
| 2019 | $3,845 | $54,660 | $31,510 | $23,150 |
| 2018 | $3,845 | $45,020 | $11,950 | $33,070 |
| 2017 | $3,822 | $54,660 | $31,510 | $23,150 |
| 2016 | $3,822 | $54,660 | $31,510 | $23,150 |
| 2015 | $3,148 | $54,660 | $31,510 | $23,150 |
| 2014 | $3,148 | $54,660 | $31,510 | $23,150 |
Source: Public Records
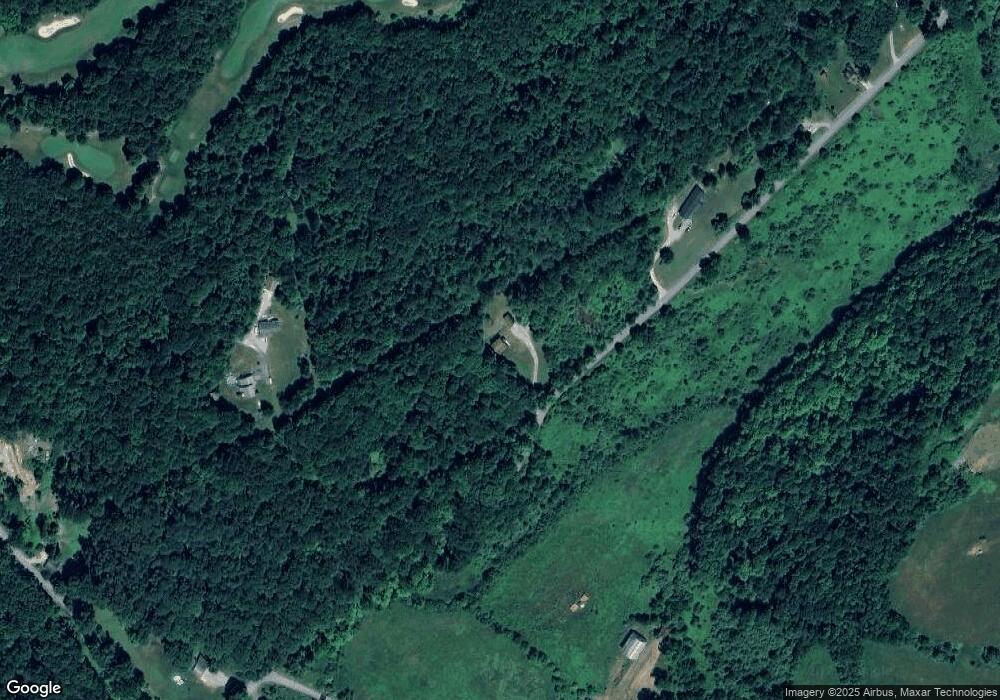
Map
Nearby Homes
- 1239 Old State Rd
- 28 Clark Ave
- 000 Flat Rock Rd
- 604 Patterson Rd
- 139 Maple Dr
- 0 Lutheran Church Rd
- Lot A Guthrie Rd
- 957 Cherry Lane Rd
- Lot 10 Beulah Church Rd
- Lot 6 Horrell Rd
- 4038 Pennsylvania 156
- 712 16th St
- 1805 Moore Ave
- 1212 Gravel Bar Rd
- 1677 Shady Plain Rd
- 2106 River Rd
- 625 Rose St Unit 276
- 726 N 4th St
- 311 & 313 N 2nd St
- 129 Franklin Ave
- 1037 Martin Rd
- 1081 Blacks Hollow Rd
- 1097 Edmon Rd
- 1077 Edmon Rd
- 1053 Edmon Rd
- 1051 Edmon Rd
- 1058 Edmon Rd
- 1050 Edmon Rd
- 1041 Edmon Rd
- 1031 Edmon Rd
- 000 Allshouse
- 1111 Blacks Hollow Rd
- 1021 Edmon Rd
- 1020 Edmon Rd
- 1101 Martin Rd
- 1129 Edmon Rd
- 1127 Martin Rd
- 1116 Martin Rd
- 3338 Mccartney Rd
- 969 Edmon Rd