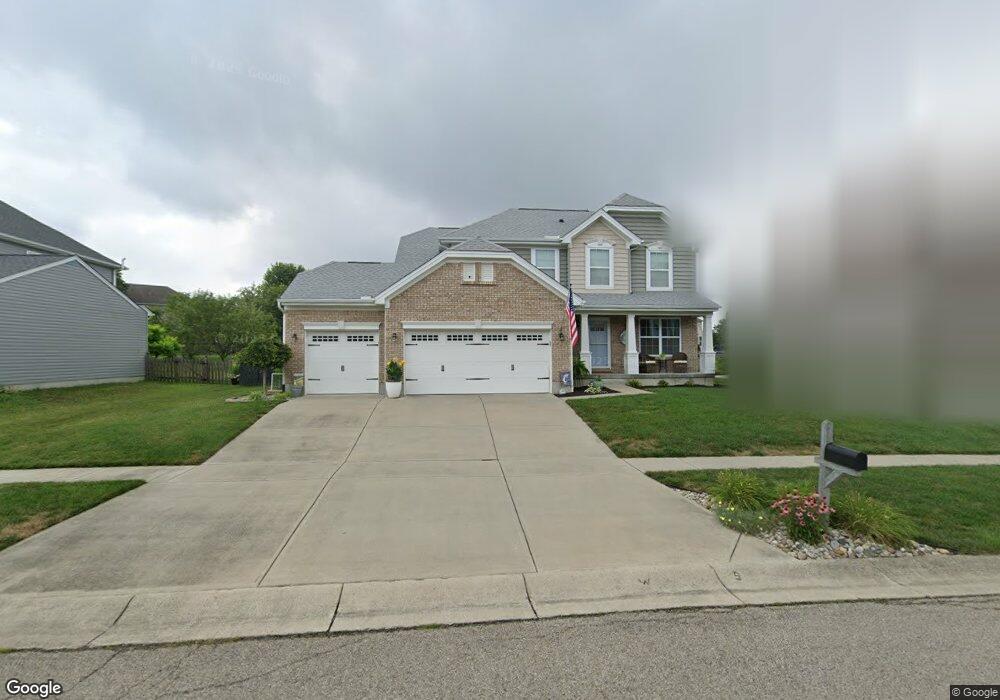
1057 Oak Forest Dr Morrow, OH 45152
Estimated Value: $419,000 - $504,000
3
Beds
3
Baths
2,153
Sq Ft
$206/Sq Ft
Est. Value
About This Home
This home is located at 1057 Oak Forest Dr, Morrow, OH 45152 and is currently estimated at $442,724, approximately $205 per square foot. 1057 Oak Forest Dr is a home with nearby schools including Little Miami Early Childhood Center, Little Miami Intermediate Middle School, and Little Miami Middle School.
Ownership History
Date
Name
Owned For
Owner Type
Purchase Details
Closed on
Jun 13, 2014
Sold by
Inverness Group Inc
Bought by
Gavey Nickolas Edward and Gavey Jennifer Lynn
Current Estimated Value
Home Financials for this Owner
Home Financials are based on the most recent Mortgage that was taken out on this home.
Original Mortgage
$192,000
Outstanding Balance
$144,319
Interest Rate
4.2%
Mortgage Type
New Conventional
Estimated Equity
$298,405
Purchase Details
Closed on
Jan 20, 2014
Sold by
G & G Land Group Llc
Bought by
Inverness Group Inc
Home Financials for this Owner
Home Financials are based on the most recent Mortgage that was taken out on this home.
Original Mortgage
$20,000,000
Interest Rate
4.55%
Mortgage Type
Purchase Money Mortgage
Purchase Details
Closed on
Feb 23, 2009
Sold by
The Ryland Group Inc
Bought by
G & G Land Group Llc
Purchase Details
Closed on
Dec 30, 2003
Sold by
Towne Development Group Ltd
Bought by
Ryland Group Inc
Create a Home Valuation Report for This Property
The Home Valuation Report is an in-depth analysis detailing your home's value as well as a comparison with similar homes in the area
Home Values in the Area
Average Home Value in this Area
Purchase History
We collect this data history from publicly available records. To have your information removed, we recommend requesting removal directly through your county’s website.
| Date | Buyer | Sale Price | Title Company |
|---|---|---|---|
| Gavey Nickolas Edward | $213,467 | None Available | |
| Inverness Group Inc | $28,000 | None Available | |
| G & G Land Group Llc | $1,166 | Sterling Title | |
| Ryland Group Inc | $303,766 | Ryland Title Company |
Source: Public Records
Mortgage History
We collect this data history from publicly available records. To have your information removed, we recommend requesting removal directly through your county’s website.
| Date | Status | Borrower | Loan Amount |
|---|---|---|---|
| Open | Gavey Nickolas Edward | $192,000 | |
| Previous Owner | Inverness Group Inc | $20,000,000 |
Source: Public Records
Tax History
| Year | Tax Paid | Tax Assessment Tax Assessment Total Assessment is a certain percentage of the fair market value that is determined by local assessors to be the total taxable value of land and additions on the property. | Land | Improvement |
|---|---|---|---|---|
| 2025 | $5,485 | $123,600 | $28,000 | $95,600 |
| 2024 | $5,485 | $123,600 | $28,000 | $95,600 |
| 2023 | $4,966 | $99,816 | $12,915 | $86,901 |
| 2022 | $4,508 | $91,809 | $12,915 | $78,894 |
| 2021 | $4,297 | $91,809 | $12,915 | $78,894 |
| 2020 | $4,092 | $74,641 | $10,500 | $64,141 |
| 2019 | $4,160 | $74,641 | $10,500 | $64,141 |
| 2018 | $4,066 | $74,641 | $10,500 | $64,141 |
| 2017 | $3,469 | $63,868 | $9,177 | $54,691 |
| 2016 | $3,468 | $62,335 | $9,177 | $53,158 |
| 2015 | $3,466 | $62,335 | $9,177 | $53,158 |
| 2014 | $593 | $9,180 | $9,180 | $0 |
| 2013 | $583 | $10,500 | $10,500 | $0 |
Source: Public Records
Map
Nearby Homes
- 1076 Oak Forest Dr
- 5984 Oak Leaf Ct
- 873 U S 22
- 723 Grande Oaks Dr
- 668 Thornton Dr
- 6289 Maple Grove
- 5619 Beechtree Ln
- 6212 Turning Leaf Way
- 547 Woodbine Ct
- 6557 N Andover Way
- 5548 Windsor Ct
- 6017 Turning Leaf Way
- 6607 N Andover Way
- 6492 Abingdon Hall
- 5004 Ross Ridge Rd
- 5000 Ross Ridge Rd
- 5004 Ross Ridge
- 151 Arbor Glen Ct
- 5687 Pepperridge Ct
- 199 Saddle Creek Ln
- 1051 Oak Forest Dr
- 1063 Oak Forest Dr
- 1045 Oak Forest Dr
- 1058 Oak Forest Dr
- 1052 Oak Forest Dr
- 964 Spruce Glen
- 1064 Oak Forest Dr
- 1046 Oak Forest Dr
- 1070 Oak Forest Dr
- 1039 Oak Forest Dr
- 976 Spruce Glen
- 956 Spruce Glen
- 968 Spruce Glen
- 984 Spruce Glen
- 979 Oak Forest Dr
- 6147 Avebury Ct
- 960 Spruce Glen
- 992 Spruce Glen
- 967 Oak Forest Dr
- 6153 Avebury Ct
Your Personal Tour Guide
Ask me questions while you tour the home.