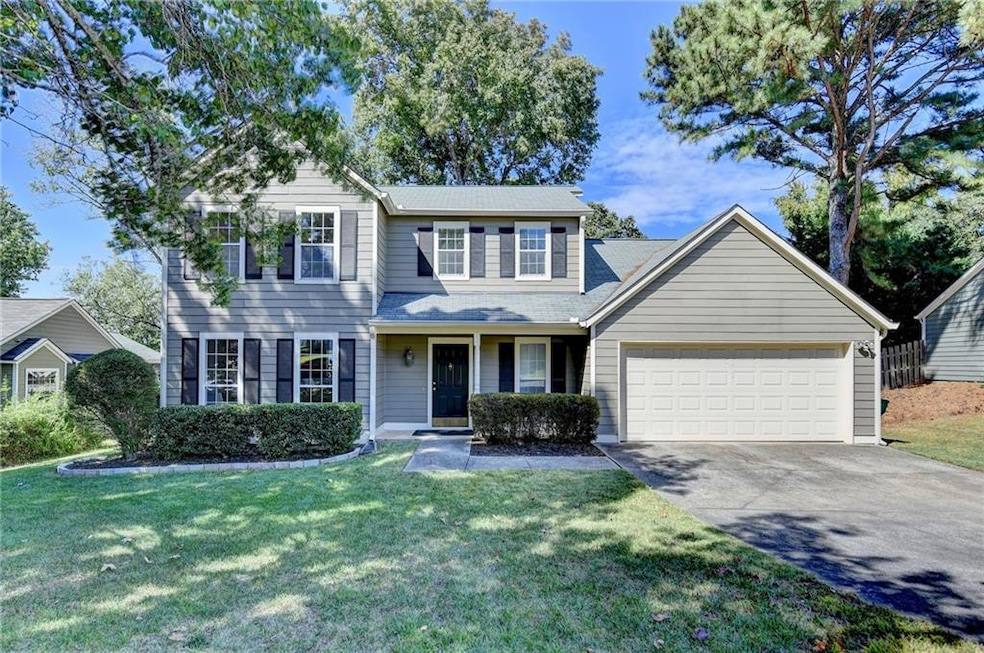

10570 Bridgemor Dr Alpharetta, GA 30022
Estimated payment $2,804/month
Highlights
- Property is near public transit
- Vaulted Ceiling
- Traditional Architecture
- State Bridge Crossing Elementary School Rated A
- Oversized primary bedroom
- Attic
About This Home
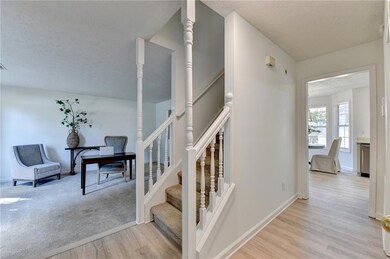
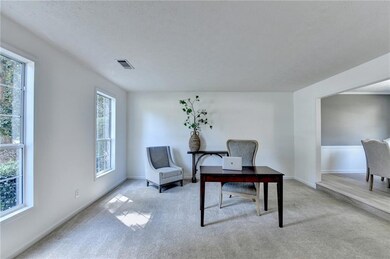
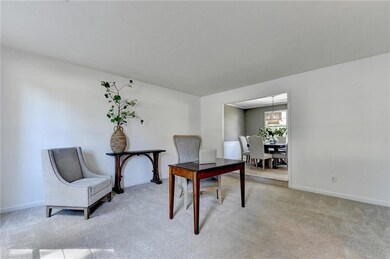
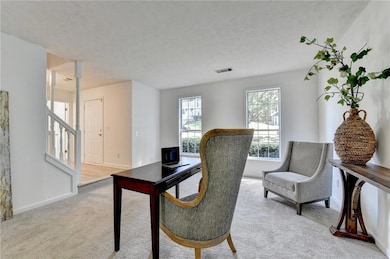
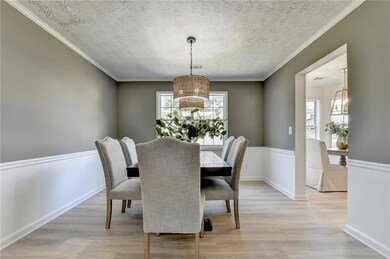
WOW!!! Finally a renovated and move in ready home priced reasonably. Freshly painted interior. Freshly painted kitchen cabinets and new floating shelves installed to store plates and so much more. The updated kitchen is ready to go! The view into the family room is unforgettable. Enjoy newly installed LVP in most of the main level which is perfect. Only carpet on the main level is the front office. Convenient and oversized laundry room main level. New Lighting. Just painted back fence. Everything is designer gorgeous! Upstairs you will love three nicely sized bedrooms, a large primary bath and well appointed secondary bath. Wrap it up with cement siding which is low maintenance and a lovely front porch to welcome you home. This is a 10 out of 10! Located in a superb location with best schools and no HOA, you will want to see this beauty quickly!
Listing Agent
Keller Williams Realty Chattahoochee North, LLC License #366591 Listed on: 09/23/2025

Home Details
Home Type
- Single Family
Est. Annual Taxes
- $5,186
Year Built
- Built in 1990 | Remodeled
Lot Details
- 9,191 Sq Ft Lot
- Landscaped
- Back Yard Fenced and Front Yard
Parking
- 2 Car Garage
- Front Facing Garage
Home Design
- Traditional Architecture
- Slab Foundation
- Composition Roof
- Cement Siding
Interior Spaces
- 1,922 Sq Ft Home
- 2-Story Property
- Vaulted Ceiling
- Ceiling Fan
- Fireplace With Gas Starter
- Bay Window
- Entrance Foyer
- Family Room with Fireplace
- Living Room with Fireplace
- Formal Dining Room
- Neighborhood Views
- Pull Down Stairs to Attic
- Fire and Smoke Detector
Kitchen
- Open to Family Room
- Eat-In Kitchen
- Electric Oven
- Gas Range
- Range Hood
- Microwave
- Dishwasher
- Laminate Countertops
- Disposal
Flooring
- Carpet
- Ceramic Tile
- Luxury Vinyl Tile
Bedrooms and Bathrooms
- 3 Bedrooms
- Oversized primary bedroom
- Walk-In Closet
- Dual Vanity Sinks in Primary Bathroom
- Separate Shower in Primary Bathroom
Laundry
- Laundry Room
- Laundry on main level
Outdoor Features
- Patio
- Rain Gutters
Location
- Property is near public transit
- Property is near schools
- Property is near shops
Schools
- State Bridge Crossing Elementary School
- Taylor Road Middle School
- Chattahoochee High School
Utilities
- Central Heating and Cooling System
- Underground Utilities
- High Speed Internet
- Phone Available
- Cable TV Available
Listing and Financial Details
- Assessor Parcel Number 11 048301860678
Community Details
Overview
- Bridgemor Heights Subdivision
Recreation
- Trails
Map
Home Values in the Area
Average Home Value in this Area
Tax History
| Year | Tax Paid | Tax Assessment Tax Assessment Total Assessment is a certain percentage of the fair market value that is determined by local assessors to be the total taxable value of land and additions on the property. | Land | Improvement |
|---|---|---|---|---|
| 2025 | $5,186 | $158,440 | $42,320 | $116,120 |
| 2023 | $3,894 | $137,960 | $28,280 | $109,680 |
| 2022 | $3,810 | $124,160 | $25,400 | $98,760 |
| 2021 | $3,505 | $111,240 | $23,320 | $87,920 |
| 2020 | $3,290 | $102,200 | $23,320 | $78,880 |
| 2019 | $396 | $100,400 | $22,920 | $77,480 |
| 2018 | $2,876 | $88,320 | $20,920 | $67,400 |
| 2017 | $2,335 | $68,600 | $14,480 | $54,120 |
| 2016 | $2,301 | $68,600 | $14,480 | $54,120 |
| 2015 | $2,327 | $68,600 | $14,480 | $54,120 |
| 2014 | $1,920 | $68,600 | $14,480 | $54,120 |
Property History
| Date | Event | Price | List to Sale | Price per Sq Ft |
|---|---|---|---|---|
| 09/23/2025 09/23/25 | For Sale | $450,000 | -- | $234 / Sq Ft |
Purchase History
| Date | Type | Sale Price | Title Company |
|---|---|---|---|
| Deed | $32,000 | -- | |
| Deed | $32,000 | -- | |
| Deed | $155,000 | -- | |
| Deed | $155,000 | -- | |
| Deed | $156,900 | -- |
Mortgage History
| Date | Status | Loan Amount | Loan Type |
|---|---|---|---|
| Closed | $125,000 | New Conventional | |
| Previous Owner | $124,000 | New Conventional | |
| Previous Owner | $125,500 | New Conventional |
Source: First Multiple Listing Service (FMLS)
MLS Number: 7654168
APN: 11-0483-0186-067-8
Disclaimer: Certain information contained herein is derived from information provided by parties other than Homes.com. All information provided is deemed reliable, but is not guaranteed to be accurate and should be independently verified.
![]() Listings identified with the FMLS IDX logo come from FMLS and are held by brokerage firms other than the owner of this website. The listing brokerage is identified in any listing details. Information is deemed reliable but is not guaranteed. If you believe any FMLS listing contains material that infringes your copyrighted work please visit www.fmls.com/dmca to review our DMCA policy and learn how to submit a takedown request. © 2025 First Multiple Listing Service, Inc.
Listings identified with the FMLS IDX logo come from FMLS and are held by brokerage firms other than the owner of this website. The listing brokerage is identified in any listing details. Information is deemed reliable but is not guaranteed. If you believe any FMLS listing contains material that infringes your copyrighted work please visit www.fmls.com/dmca to review our DMCA policy and learn how to submit a takedown request. © 2025 First Multiple Listing Service, Inc.
- 230 Pinebridge Ct
- 220 Magnolia Tree Ct
- 10840 Mortons Crossing
- 225 Morton Creek Cir
- 10906 Gallier St
- 5170 Cameron Forest Pkwy
- 10265 Minion Ct Unit 27
- 10281 Midway Ave
- 515 Avian Ct
- 10296 Quadrant Ct Unit 76
- 4815 Tanners Spring Dr
- 750 Gates Ln
- 513 Camden Hall Dr
- 200 Boca Ciega Ct
- 5022 Anclote Dr
- 465 Mikasa Dr
- 4965 Cinnabar Dr
- 230 Skidaway Ct
- 309 Mannes Ln
- 10780 Mortons Crossing
- 10650 Allon Cove Unit 137
- 10830 Mortons Crossing
- 4822 Abberley Ln
- 4885 Streamside Dr
- 4800 Streamside Dr
- 10898 Gallier St
- 4935 Tanners Spring Dr
- 10840 State Bridge Rd
- 350 Saddle Bridge Dr
- 11080 Mortons Crossing
- 130 Anclote Ct
- 5345 Cameron Forest Pkwy
- 5022 Anclote Dr
- 4645 Valais Ct Unit 32
- 4645 Valais Ct Unit 90
- 4645 Valais Ct Unit 53
- 4645 Valais Ct Unit 114
- 5105 N Bridges Dr