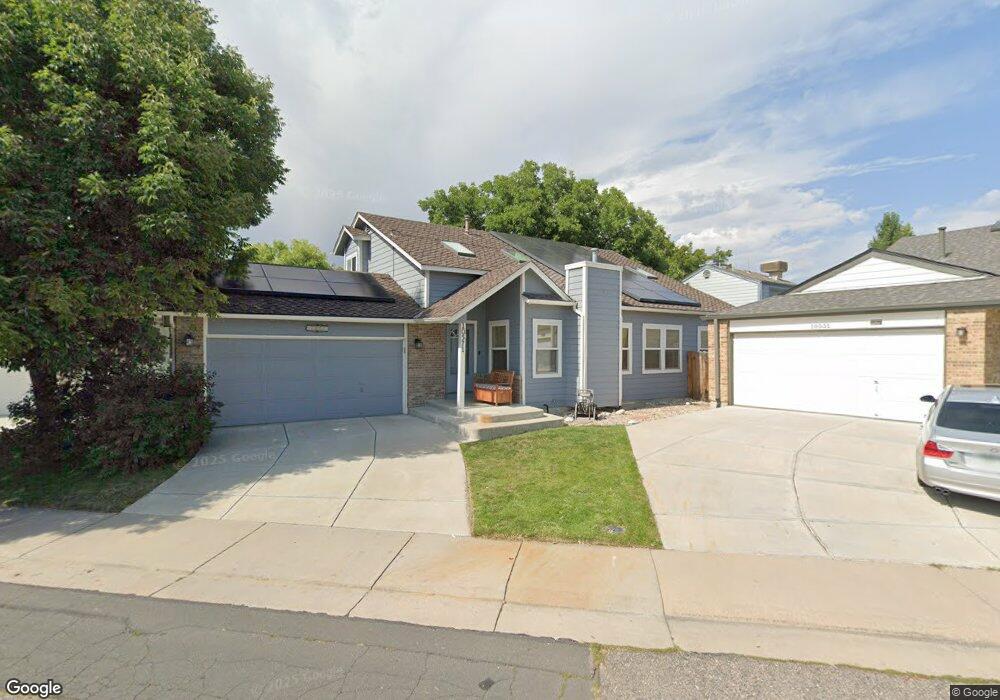
10571 W 83rd Place Arvada, CO 80005
Lakecrest NeighborhoodEstimated Value: $592,000 - $651,523
4
Beds
3
Baths
3,076
Sq Ft
$202/Sq Ft
Est. Value
About This Home
This home is located at 10571 W 83rd Place, Arvada, CO 80005 and is currently estimated at $621,381, approximately $202 per square foot. 10571 W 83rd Place is a home located in Jefferson County with nearby schools including Sierra Elementary School, Oberon Middle School, and Ralston Valley Senior High School.
Ownership History
Date
Name
Owned For
Owner Type
Purchase Details
Closed on
Jun 22, 2018
Bought by
Mann Josh
Current Estimated Value
Home Financials for this Owner
Home Financials are based on the most recent Mortgage that was taken out on this home.
Original Mortgage
$340,000
Outstanding Balance
$294,505
Interest Rate
4.57%
Estimated Equity
$326,877
Purchase Details
Closed on
Aug 3, 1995
Sold by
Sunburst Mdc Inc
Bought by
Roman Orlando and Roman Barbara Kathleen
Home Financials for this Owner
Home Financials are based on the most recent Mortgage that was taken out on this home.
Original Mortgage
$138,600
Interest Rate
7.51%
Purchase Details
Closed on
May 31, 1994
Sold by
Holben Stephen B
Bought by
Sunburst M D C Inc
Create a Home Valuation Report for This Property
The Home Valuation Report is an in-depth analysis detailing your home's value as well as a comparison with similar homes in the area
Home Values in the Area
Average Home Value in this Area
Purchase History
| Date | Buyer | Sale Price | Title Company |
|---|---|---|---|
| Mann Josh | $425,000 | -- | |
| Roman Orlando | $145,907 | First American Heritage Titl | |
| Sunburst M D C Inc | $17,000 | -- |
Source: Public Records
Mortgage History
| Date | Status | Borrower | Loan Amount |
|---|---|---|---|
| Open | Mann Josh | $340,000 | |
| Closed | Mann Josh | -- | |
| Previous Owner | Roman Orlando | $138,600 |
Source: Public Records
Tax History
| Year | Tax Paid | Tax Assessment Tax Assessment Total Assessment is a certain percentage of the fair market value that is determined by local assessors to be the total taxable value of land and additions on the property. | Land | Improvement |
|---|---|---|---|---|
| 2024 | $3,843 | $39,623 | $8,905 | $30,718 |
| 2023 | $3,843 | $39,623 | $8,905 | $30,718 |
| 2022 | $3,070 | $31,349 | $6,788 | $24,561 |
| 2021 | $3,121 | $32,251 | $6,983 | $25,268 |
| 2020 | $2,984 | $30,922 | $7,563 | $23,359 |
| 2019 | $2,944 | $30,922 | $7,563 | $23,359 |
| 2018 | $2,244 | $22,918 | $5,116 | $17,802 |
| 2017 | $2,054 | $22,918 | $5,116 | $17,802 |
| 2016 | $2,288 | $24,041 | $5,725 | $18,316 |
| 2015 | $1,944 | $24,041 | $5,725 | $18,316 |
| 2014 | $1,944 | $19,197 | $4,742 | $14,455 |
Source: Public Records
Map
Nearby Homes
- 10038 W 82nd Ln
- 10368 W 81st Ave
- 8096 Lee Ct
- 8262 Johnson Ct
- 8280 Queen St
- 10253 W 80th Dr Unit C
- 10233 W 80th Dr Unit B
- 10213 W 80th Dr Unit B
- 10585 W 79th Way
- 0 80th Ave
- 9760 W 82nd Place
- 10420 W 79th Way
- 11707 W 85th Place
- 11625 W 81st Ave
- 8055 Simms St
- 11003 W 78th Ave
- 8682 Garrison Ct
- 8684 Garrison Ct
- 8601 Garland Ct
- 8330 Garland Dr
- 10551 W 83rd Place
- 10581 W 83rd Place
- 10552 W 84th Place
- 8440 Moore Ct
- 10531 W 83rd Place
- 10532 W 84th Place
- 10570 W 83rd Place
- 10550 W 83rd Place
- 10512 W 84th Place
- 10511 W 83rd Place
- 8360 Moore Ct
- 10530 W 83rd Place
- 8405 Moore St
- 8499 Moore St
- 10553 W 84th Place
- 10510 W 83rd Place
- 10533 W 84th Place
- 8385 Moore Ct
- 8425 Moore Ct
- 10573 W 84th Place
Your Personal Tour Guide
Ask me questions while you tour the home.