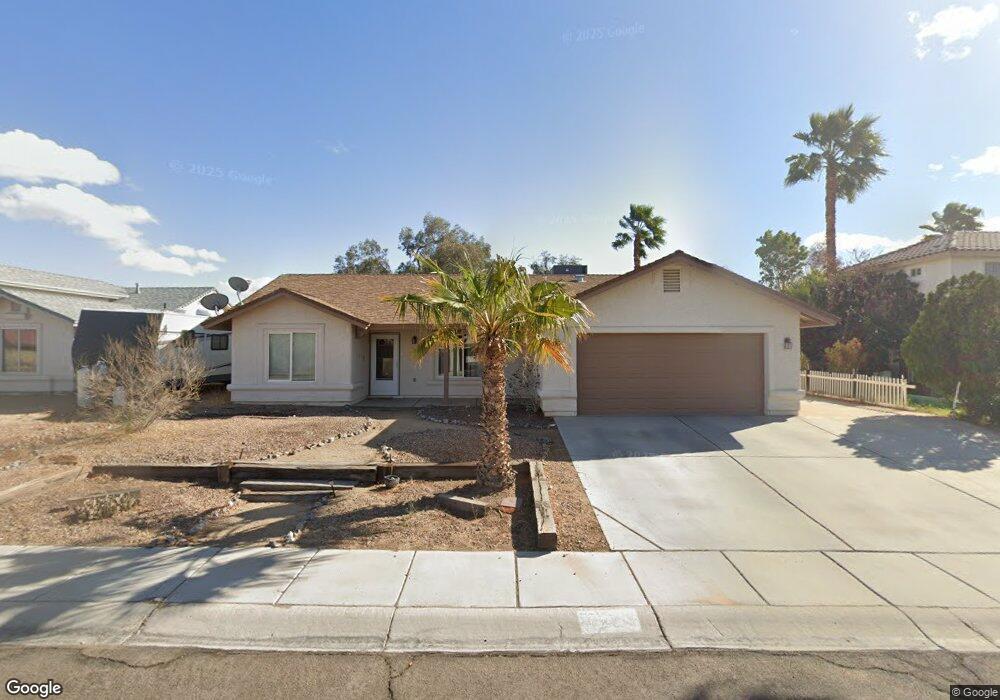
10573 E 36th St Yuma, AZ 85365
Fortuna Foothills NeighborhoodEstimated Value: $291,121 - $332,000
3
Beds
2
Baths
1,326
Sq Ft
$239/Sq Ft
Est. Value
About This Home
This home is located at 10573 E 36th St, Yuma, AZ 85365 and is currently estimated at $316,530, approximately $238 per square foot. 10573 E 36th St is a home located in Yuma County with nearby schools including Mary A. Otondo Elementary School, Castle Dome Middle School, and Gila Ridge High School.
Ownership History
Date
Name
Owned For
Owner Type
Purchase Details
Closed on
Nov 14, 2006
Sold by
Burch Andrew M
Bought by
Burch Andrew M and Andrew M Burch Revocable Living Trust
Current Estimated Value
Purchase Details
Closed on
Feb 7, 2002
Sold by
Sanchez Ewell Deborah A and Sanchez Deborah A
Bought by
Burch Andrew M and Burch Cassandra R
Home Financials for this Owner
Home Financials are based on the most recent Mortgage that was taken out on this home.
Original Mortgage
$117,740
Outstanding Balance
$47,789
Interest Rate
6.8%
Mortgage Type
New Conventional
Estimated Equity
$268,741
Purchase Details
Closed on
May 6, 1999
Sold by
Yuma Title & Trust Company
Bought by
Sanchez Deborah A
Home Financials for this Owner
Home Financials are based on the most recent Mortgage that was taken out on this home.
Original Mortgage
$92,950
Interest Rate
7.96%
Mortgage Type
New Conventional
Create a Home Valuation Report for This Property
The Home Valuation Report is an in-depth analysis detailing your home's value as well as a comparison with similar homes in the area
Home Values in the Area
Average Home Value in this Area
Purchase History
| Date | Buyer | Sale Price | Title Company |
|---|---|---|---|
| Burch Andrew M | -- | None Available | |
| Burch Andrew M | $116,000 | First American Title | |
| Sanchez Deborah A | $92,284 | Yuma Title |
Source: Public Records
Mortgage History
| Date | Status | Borrower | Loan Amount |
|---|---|---|---|
| Open | Burch Andrew M | $117,740 | |
| Previous Owner | Sanchez Deborah A | $92,950 |
Source: Public Records
Tax History
| Year | Tax Paid | Tax Assessment Tax Assessment Total Assessment is a certain percentage of the fair market value that is determined by local assessors to be the total taxable value of land and additions on the property. | Land | Improvement |
|---|---|---|---|---|
| 2025 | $1,787 | $17,719 | $4,870 | $12,849 |
| 2024 | $1,767 | $16,876 | $4,546 | $12,330 |
| 2023 | $1,767 | $16,072 | $4,713 | $11,359 |
| 2022 | $1,712 | $15,307 | $5,020 | $10,287 |
| 2021 | $1,807 | $14,578 | $4,777 | $9,801 |
| 2020 | $1,670 | $13,884 | $4,213 | $9,671 |
| 2019 | $1,657 | $13,223 | $4,146 | $9,077 |
| 2018 | $1,603 | $12,593 | $3,823 | $8,770 |
| 2017 | $1,552 | $12,593 | $3,823 | $8,770 |
| 2016 | $1,589 | $12,553 | $4,250 | $8,303 |
| 2015 | -- | $12,086 | $4,250 | $7,836 |
| 2014 | -- | $11,969 | $4,100 | $7,869 |
Source: Public Records
Map
Nearby Homes
- 10579 E 35th St
- 10617 E 37th St
- 10452 E 37th St
- 10725 E 35th St Unit II
- 10690 E 38th St
- 11653 S Chaparral Dr
- 10534 E 38th Place
- 10782 E 36th Place
- 11393 S Kingman Ave
- 11559 S Prescott Ave
- 10714 E 38th Ln
- 10324 E 37th St
- 10310 E 37th Place
- 10739 E 39th St
- 10203 E 37th Place
- 10358 E 39th Way
- 11279 S Phoenix Dr
- 11233 E 35th Place
- 10200 E 39th St
- 10134 E 35th St
- 10561 E 36th St
- 10585 E 36th St
- 10595 E 36th St
- 10574 E 36th Place
- 10562 E 36th Place
- 10586 E 36th Place
- 10597 E 36th St
- 10549 E 36th St
- 10572 E 36th St
- 10584 E 36th St
- 10560 E 36th St
- 10598 E 36th Place
- 10550 E 36th Place
- 10596 E 36th St
- 10537 E 36th St
- 10609 E 36th St
- 10548 E 36th St
- 10538 E 36th Place
- 10610 E 36th Place
- 10608 E 36th St
Your Personal Tour Guide
Ask me questions while you tour the home.