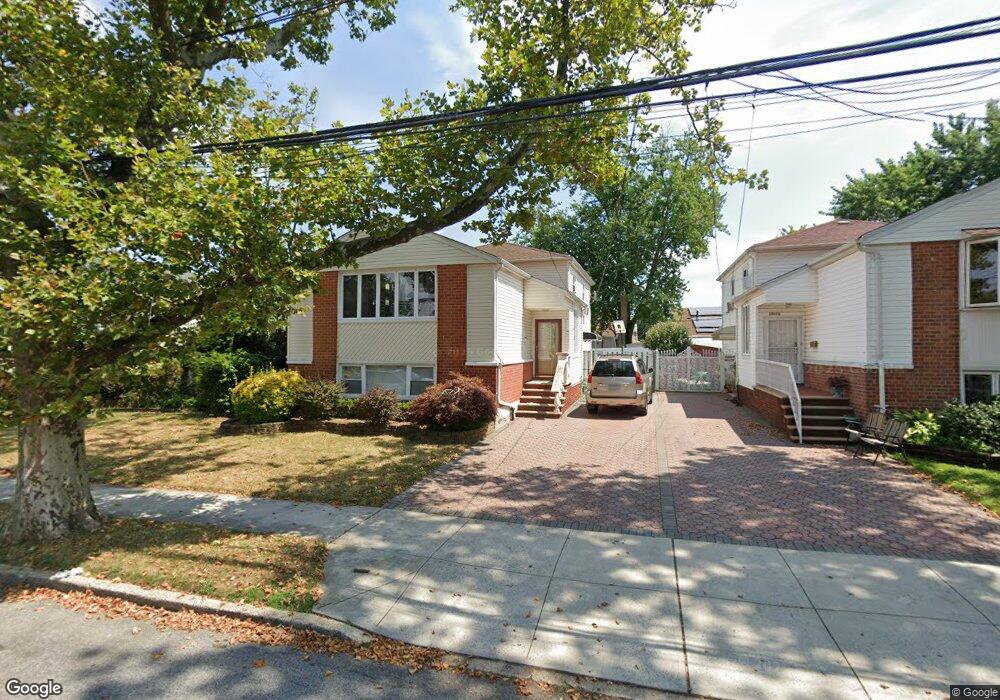
10578 Flatlands 7th St Brooklyn, NY 11236
Canarsie NeighborhoodEstimated Value: $700,588 - $1,041,000
--
Bed
--
Bath
2,392
Sq Ft
$383/Sq Ft
Est. Value
About This Home
This home is located at 10578 Flatlands 7th St, Brooklyn, NY 11236 and is currently estimated at $915,147, approximately $382 per square foot. 10578 Flatlands 7th St is a home located in Kings County with nearby schools including P.S. 272 Curtis Estabrook, I.S. 211 John Wilson, and Leadership Preparatory Canarsie Charter School.
Ownership History
Date
Name
Owned For
Owner Type
Purchase Details
Closed on
Feb 11, 2019
Sold by
Joseph Eveline and Joseph Evelyne
Bought by
Leonard Joseph Evelyne and Leonard Joseph
Current Estimated Value
Home Financials for this Owner
Home Financials are based on the most recent Mortgage that was taken out on this home.
Original Mortgage
$350,000
Outstanding Balance
$307,085
Interest Rate
4.4%
Mortgage Type
Purchase Money Mortgage
Estimated Equity
$608,062
Purchase Details
Closed on
Jan 1, 1996
Sold by
Fershtman Gerry and Fershtman Smadar
Bought by
Joseph Leonard and Joseph Evelyne
Home Financials for this Owner
Home Financials are based on the most recent Mortgage that was taken out on this home.
Original Mortgage
$184,800
Interest Rate
7.02%
Create a Home Valuation Report for This Property
The Home Valuation Report is an in-depth analysis detailing your home's value as well as a comparison with similar homes in the area
Home Values in the Area
Average Home Value in this Area
Purchase History
| Date | Buyer | Sale Price | Title Company |
|---|---|---|---|
| Leonard Joseph Evelyne | -- | -- | |
| Joseph Leonard | $231,000 | -- |
Source: Public Records
Mortgage History
| Date | Status | Borrower | Loan Amount |
|---|---|---|---|
| Open | Leonard Joseph Evelyne | $350,000 | |
| Previous Owner | Joseph Leonard | $184,800 |
Source: Public Records
Tax History Compared to Growth
Tax History
| Year | Tax Paid | Tax Assessment Tax Assessment Total Assessment is a certain percentage of the fair market value that is determined by local assessors to be the total taxable value of land and additions on the property. | Land | Improvement |
|---|---|---|---|---|
| 2025 | $8,552 | $44,400 | $13,440 | $30,960 |
| 2024 | $8,552 | $51,000 | $13,440 | $37,560 |
| 2023 | $8,580 | $57,420 | $13,440 | $43,980 |
| 2022 | $5,950 | $46,260 | $13,440 | $32,820 |
| 2021 | $7,879 | $46,260 | $13,440 | $32,820 |
| 2020 | $5,909 | $42,960 | $13,440 | $29,520 |
| 2019 | $7,374 | $41,700 | $13,440 | $28,260 |
| 2018 | $7,117 | $36,372 | $11,556 | $24,816 |
| 2017 | $6,695 | $34,314 | $13,161 | $21,153 |
| 2016 | $6,162 | $32,372 | $10,555 | $21,817 |
| 2015 | $3,989 | $30,540 | $14,940 | $15,600 |
| 2014 | $3,989 | $30,540 | $14,940 | $15,600 |
Source: Public Records
Map
Nearby Homes
- 10567 Flatlands 7th St
- 10561 Flatlands 7th St
- 10811 Flatlands 7th St
- 10542 Flatlands 7th St
- 10584 Flatlands 6th St
- 10830 Avenue N
- 108-10 Flatlands 9th St Unit 15C
- 1409 E 105th St
- 10820 Flatlands 9th St Unit 18D
- 1431 E 108th St Unit 10E
- 1375 E 104th St
- 10849 Seaview Ave Unit 29B
- 1251 E 104th St
- 10813 Seaview Ave Unit 41B
- 10541 Seaview Ave
- 1418 E 104th St
- 10573 Avenue L
- 10406 Avenue L
- 10310 Avenue L
- 10523 Flatlands 3rd St
- 10572 Flatlands 7th St
- 10584 Flatlands 7th St
- 10568 Flatlands 7th St
- 10577 Flatlands 8th St
- 10583 Flatlands 8th St
- 10571 Flatlands 8th St
- 10562 Flatlands 7th St
- 10567 Flatlands 8th St
- 10577 Flatlands 7th St
- 10804 Flatlands 7th St
- 10571 Flatlands 7th St
- 10583 Flatlands 7th St
- 10561 Flatlands 8th St
- 10558 Flatlands 7th St
- 10806 Flatlands 7th St
- 10801 Flatlands 8th St
- 10557 Flatlands 8th St
- 108 32 E Flatlands 8 St
- 10805 Flatlands 8th St
- 10810 Flatlands 7th St