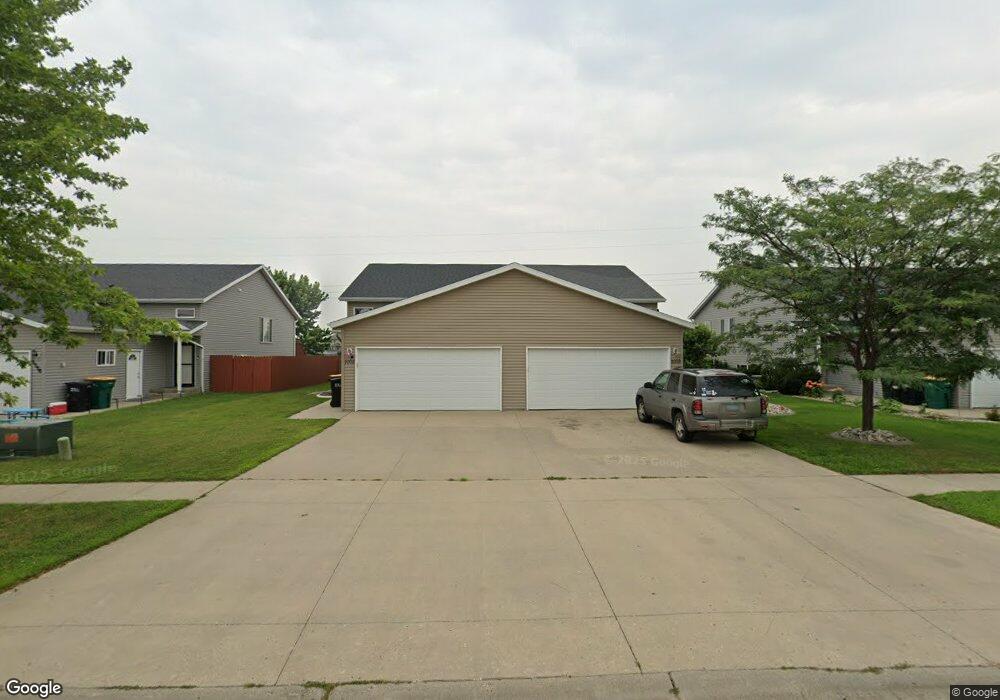
1058 38 1/2 Ave W West Fargo, ND 58078
Eagle Run NeighborhoodEstimated Value: $247,000 - $286,351
3
Beds
2
Baths
1,920
Sq Ft
$141/Sq Ft
Est. Value
About This Home
This home is located at 1058 38 1/2 Ave W, West Fargo, ND 58078 and is currently estimated at $269,838, approximately $140 per square foot. 1058 38 1/2 Ave W is a home located in Cass County with nearby schools including Aurora Elementary School, Liberty Middle School, and West Fargo Sheyenne High School.
Ownership History
Date
Name
Owned For
Owner Type
Purchase Details
Closed on
Jul 10, 2019
Sold by
Jagg Llc
Bought by
Evans Tiffany
Current Estimated Value
Home Financials for this Owner
Home Financials are based on the most recent Mortgage that was taken out on this home.
Original Mortgage
$191,468
Outstanding Balance
$169,030
Interest Rate
4.2%
Mortgage Type
FHA
Estimated Equity
$100,808
Purchase Details
Closed on
Jan 9, 2015
Sold by
Gores Jerald A and Gores Gail K
Bought by
Jagg Llc
Purchase Details
Closed on
May 1, 2014
Sold by
Randall Anthony and Randall Paula
Bought by
Gores Jerald A and Gores Gail K
Home Financials for this Owner
Home Financials are based on the most recent Mortgage that was taken out on this home.
Original Mortgage
$114,191
Interest Rate
4.33%
Mortgage Type
New Conventional
Purchase Details
Closed on
Apr 2, 2007
Sold by
Danielson Andrea Beth
Bought by
Randall Anthony Robert
Create a Home Valuation Report for This Property
The Home Valuation Report is an in-depth analysis detailing your home's value as well as a comparison with similar homes in the area
Home Values in the Area
Average Home Value in this Area
Purchase History
| Date | Buyer | Sale Price | Title Company |
|---|---|---|---|
| Evans Tiffany | $195,000 | Fm Title | |
| Jagg Llc | -- | None Available | |
| Gores Jerald A | $152,254 | None Available | |
| Randall Anthony Robert | -- | -- |
Source: Public Records
Mortgage History
| Date | Status | Borrower | Loan Amount |
|---|---|---|---|
| Open | Evans Tiffany | $191,468 | |
| Previous Owner | Gores Jerald A | $114,191 |
Source: Public Records
Tax History Compared to Growth
Tax History
| Year | Tax Paid | Tax Assessment Tax Assessment Total Assessment is a certain percentage of the fair market value that is determined by local assessors to be the total taxable value of land and additions on the property. | Land | Improvement |
|---|---|---|---|---|
| 2024 | $3,202 | $125,300 | $18,000 | $107,300 |
| 2023 | $3,576 | $120,350 | $18,000 | $102,350 |
| 2022 | $3,242 | $107,150 | $18,000 | $89,150 |
| 2021 | $2,995 | $98,550 | $13,500 | $85,050 |
| 2020 | $2,834 | $94,500 | $13,500 | $81,000 |
| 2019 | $2,800 | $92,350 | $13,500 | $78,850 |
| 2018 | $2,665 | $90,850 | $13,500 | $77,350 |
| 2017 | $2,468 | $88,050 | $13,500 | $74,550 |
| 2016 | $2,171 | $85,800 | $13,500 | $72,300 |
| 2015 | $2,030 | $75,750 | $5,700 | $70,050 |
| 2014 | $2,004 | $70,800 | $5,700 | $65,100 |
| 2013 | $2,982 | $67,100 | $5,700 | $61,400 |
Source: Public Records
Map
Nearby Homes
- 1040 39th Ave W
- 909 38 1 2 Ave W
- 3662 N Sedona Ct
- 1054 42nd Ave W
- 1156 42nd Ave W Unit A
- 1236 S Beach Way
- 1168 43rd Ave W
- 1381 Westport Beach Way
- 4509 11th St W
- 4507 Newport Ln
- 4534 Westport Pkwy
- 4717 11th St W
- 945 31st Ave W
- 922 31st Ave W
- 4757 11th St W
- 1089 Hickory Ln
- 1097 Hickory Ln
- 1015 29th Ave W
- 1082 Larkin Ln
- 360 32nd Ave W Unit 608
- 1058 38 1 2 Ave W
- 1054 38 1/2 Ave W
- 1062 38 1/2 Ave W
- 1062 38 1 2 Ave W
- 1050 38 1 2 Ave W
- 1050 38 1/2 Ave W
- 1110 38 1/2 Ave W
- 1110 38 1 2 Ave W
- 1046 38 1 2 Ave W
- 1046 38 1/2 Ave W
- 1114 38 1 2 Ave W
- 1042 38 1 2 Ave W
- 1042 38 1/2 Ave W
- 1118 38 1/2 Ave W
- 1118 38 1 2 Ave W
- 1038 38 1/2 Ave W
- 1122 38 1/2 Ave W
- 1122 38 1 2 Ave W
- 1055 38 1/2 Ave W
- 1051 38 1/2 Ave W