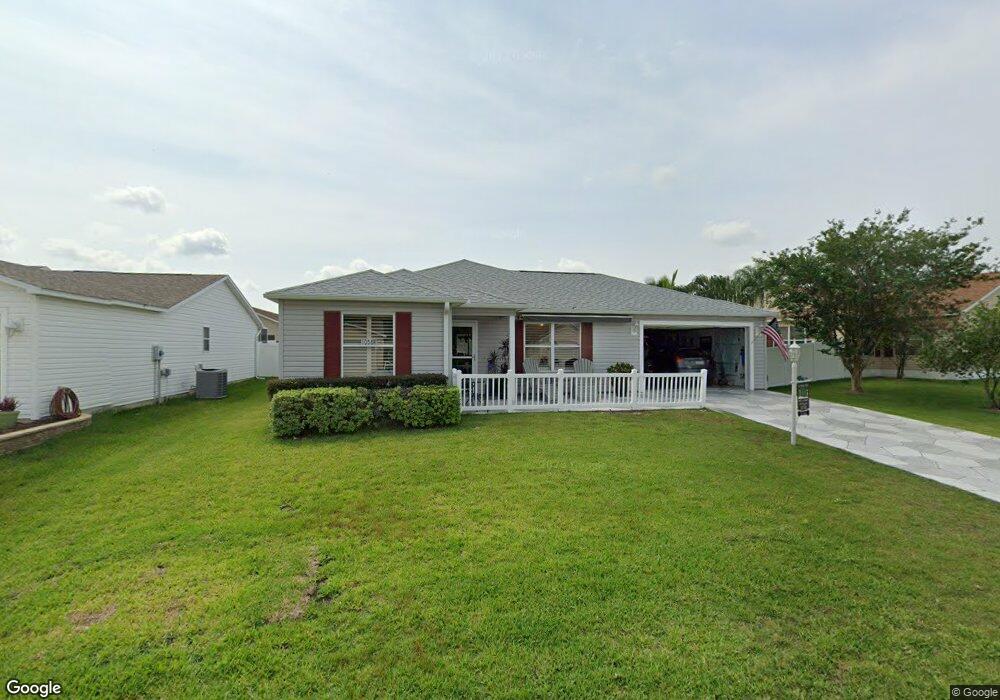
1058 Nash Loop The Villages, FL 32162
Village of Hemingway NeighborhoodEstimated Value: $286,704 - $350,000
--
Bed
--
Bath
1,142
Sq Ft
$269/Sq Ft
Est. Value
About This Home
This home is located at 1058 Nash Loop, The Villages, FL 32162 and is currently estimated at $307,676, approximately $269 per square foot. 1058 Nash Loop is a home located in Sumter County with nearby schools including Wildwood Elementary School and Wildwood Middle/High School.
Ownership History
Date
Name
Owned For
Owner Type
Purchase Details
Closed on
Nov 6, 2018
Sold by
Egan Thomas J and Egan Mary
Bought by
Mccoach William and Mccoach Cynthia L
Current Estimated Value
Home Financials for this Owner
Home Financials are based on the most recent Mortgage that was taken out on this home.
Original Mortgage
$115,400
Outstanding Balance
$73,099
Interest Rate
4.9%
Mortgage Type
New Conventional
Estimated Equity
$234,577
Purchase Details
Closed on
Aug 24, 2017
Sold by
Hart Karen W
Bought by
Egan Thomas J and Egan Mary
Home Financials for this Owner
Home Financials are based on the most recent Mortgage that was taken out on this home.
Original Mortgage
$199,400
Interest Rate
3.96%
Mortgage Type
New Conventional
Purchase Details
Closed on
Jul 23, 2008
Sold by
The Villages Of Lake Sumter Inc
Bought by
Hart Larry R and Hart Karen W
Home Financials for this Owner
Home Financials are based on the most recent Mortgage that was taken out on this home.
Original Mortgage
$131,000
Interest Rate
6.37%
Mortgage Type
Purchase Money Mortgage
Create a Home Valuation Report for This Property
The Home Valuation Report is an in-depth analysis detailing your home's value as well as a comparison with similar homes in the area
Home Values in the Area
Average Home Value in this Area
Purchase History
| Date | Buyer | Sale Price | Title Company |
|---|---|---|---|
| Mccoach William | $225,400 | Peninsula Land & Title | |
| Egan Thomas J | $209,900 | Peninsula Land & Title | |
| Hart Larry R | $163,800 | Attorney |
Source: Public Records
Mortgage History
| Date | Status | Borrower | Loan Amount |
|---|---|---|---|
| Open | Mccoach William | $115,400 | |
| Previous Owner | Egan Thomas J | $199,400 | |
| Previous Owner | Hart Larry R | $131,000 |
Source: Public Records
Tax History Compared to Growth
Tax History
| Year | Tax Paid | Tax Assessment Tax Assessment Total Assessment is a certain percentage of the fair market value that is determined by local assessors to be the total taxable value of land and additions on the property. | Land | Improvement |
|---|---|---|---|---|
| 2024 | $643 | $200,210 | -- | -- |
| 2023 | $643 | $194,380 | $0 | $0 |
| 2022 | $575 | $188,720 | $0 | $0 |
| 2021 | $575 | $183,230 | $22,970 | $160,260 |
| 2020 | $1,879 | $181,260 | $17,270 | $163,990 |
| 2019 | $3,584 | $181,080 | $17,270 | $163,810 |
| 2018 | $3,232 | $158,200 | $17,270 | $140,930 |
| 2017 | $3,733 | $159,740 | $17,270 | $142,470 |
| 2016 | $3,740 | $161,290 | $0 | $0 |
| 2015 | $3,725 | $160,590 | $0 | $0 |
| 2014 | $3,733 | $147,970 | $0 | $0 |
Source: Public Records
Map
Nearby Homes
- 2552 Mariel Way
- 2516 Banning Ct
- 971 Margaux Trail
- 1001 Greyford Ln
- 892 Nash Loop
- 2355 Glade Run
- 2377 Longbow Trail
- 915 Chapman Loop
- 1135 Burke Ct
- 859 Chapman Loop
- 2418 Columbia Way
- 1098 Burnettown Place
- 1110 Burnettown Place
- 2378 Columbia Way
- 2495 Dundee Terrace
- 2454 Monroe Terrace
- 2361 India Hook Terrace
- 2739 Midland Terrace
- 2208 Pilar Place
- 1380 Tallowtree Dr
- 1054 Nash Loop
- 1078 Nash Loop
- 2516 Knox Terrace
- 2512 Knox Terrace
- 1052 Nash Loop
- 1082 Nash Loop
- 2508 Knox Terrace
- 1061 Nash Loop
- 1057 Nash Loop Unit 138
- 1065 Nash Loop
- 1086 Nash Loop
- 1048 Nash Loop
- 2500 Knox Terrace
- 1028 Orrick Ln
- 1049 Nash Loop
- 1090 Nash Loop
- 1069 Nash Loop
- 2496 Knox Terrace
- 1046 Nash Loop Unit 138
- 1077 Nash Loop