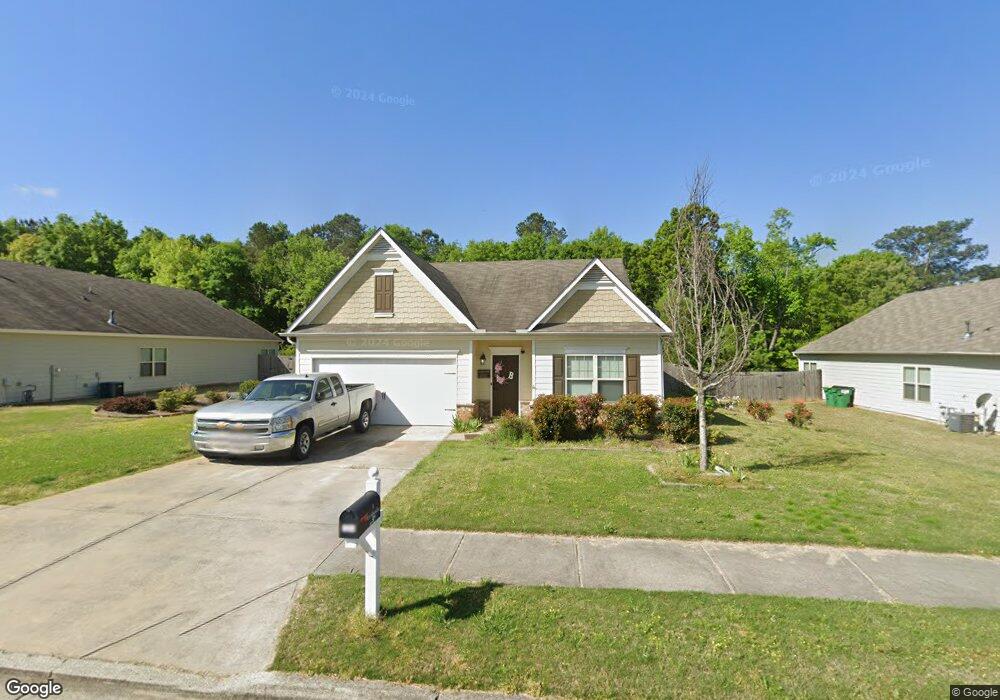
1058 Sutherland Dr Unit 29 A Winder, GA 30680
Estimated Value: $317,233 - $337,000
3
Beds
2
Baths
1,601
Sq Ft
$203/Sq Ft
Est. Value
About This Home
This home is located at 1058 Sutherland Dr Unit 29 A, Winder, GA 30680 and is currently estimated at $325,558, approximately $203 per square foot. 1058 Sutherland Dr Unit 29 A is a home located in Barrow County with nearby schools including Kennedy Elementary School, Westside Middle School, and Apalachee High School.
Ownership History
Date
Name
Owned For
Owner Type
Purchase Details
Closed on
Jan 30, 2015
Sold by
Lgi Homes Georgia Llc
Bought by
Butcher Randy
Current Estimated Value
Home Financials for this Owner
Home Financials are based on the most recent Mortgage that was taken out on this home.
Original Mortgage
$162,993
Outstanding Balance
$128,159
Interest Rate
4.5%
Mortgage Type
FHA
Estimated Equity
$197,399
Purchase Details
Closed on
Oct 25, 2013
Sold by
Sutherland Land Llc
Bought by
Sutherland Land Llc And
Purchase Details
Closed on
Jun 28, 2012
Sold by
Afb&T A Division Of Synovus B
Bought by
Sutherland Land Llc
Purchase Details
Closed on
Jun 30, 2011
Sold by
Mark I Developers Inc
Bought by
Afb&T A Division Of Synovus Bank
Purchase Details
Closed on
Apr 23, 2004
Sold by
Maynard Jerry M
Bought by
Mark I Developers Inc
Create a Home Valuation Report for This Property
The Home Valuation Report is an in-depth analysis detailing your home's value as well as a comparison with similar homes in the area
Home Values in the Area
Average Home Value in this Area
Purchase History
| Date | Buyer | Sale Price | Title Company |
|---|---|---|---|
| Butcher Randy | $166,000 | -- | |
| Sutherland Land Llc And | -- | -- | |
| Sutherland Land Llc | $2,500 | -- | |
| Afb&T A Division Of Synovus Bank | -- | -- | |
| Mark I Developers Inc | $3,818,800 | -- |
Source: Public Records
Mortgage History
| Date | Status | Borrower | Loan Amount |
|---|---|---|---|
| Open | Butcher Randy | $162,993 |
Source: Public Records
Tax History Compared to Growth
Tax History
| Year | Tax Paid | Tax Assessment Tax Assessment Total Assessment is a certain percentage of the fair market value that is determined by local assessors to be the total taxable value of land and additions on the property. | Land | Improvement |
|---|---|---|---|---|
| 2024 | $3,236 | $114,834 | $25,600 | $89,234 |
| 2023 | $3,226 | $114,834 | $25,600 | $89,234 |
| 2022 | $3,020 | $89,993 | $20,400 | $69,593 |
| 2021 | $2,865 | $80,058 | $16,000 | $64,058 |
| 2020 | $2,547 | $74,522 | $16,000 | $58,522 |
| 2019 | $2,492 | $71,754 | $16,000 | $55,754 |
| 2018 | $2,351 | $67,654 | $16,000 | $51,654 |
| 2017 | $1,912 | $64,091 | $16,000 | $48,091 |
| 2016 | $1,892 | $55,762 | $16,000 | $39,762 |
| 2015 | $1,894 | $55,762 | $16,000 | $39,762 |
| 2014 | $195 | $4,368 | $4,368 | $0 |
| 2013 | -- | $1,965 | $1,965 | $0 |
Source: Public Records
Map
Nearby Homes
- 536 Dianne Ct
- 1076 Sutherland Dr
- 812 Castilla Way
- 551 Corinth Dr
- 446 Russell Cemetery Rd
- 256 Oceanliner Dr
- 252 Oceanliner Dr
- 245 Oceanliner Dr
- 29 Lighthouse Dr
- 328 Advent Dr
- 0 Gordon Ct Unit 10634940
- 0 Gordon Ct Unit 7674399
- 182 Nativity Cove Unit 30
- 182 Nativity Cove
- 0 Atlanta Hwy SE Unit 10371310
- 0 Harrison Mill Rd Unit 10522698
- 434 Aberdeen Way
- 0 Monroe Hwy Unit 7530054
- 0 Monroe Hwy Unit 10466108
- 211 Brooks Ln
- 1058 Sutherland Dr
- 1060 Sutherland Dr Unit 28 A
- 1060 Sutherland Dr
- 1056 Sutherland Dr Unit 30 A
- 1056 Sutherland Dr
- 1054 Sutherland Dr Unit 31 A
- 1054 Sutherland Dr
- 1062 Sutherland Dr Unit 27 A
- 1062 Sutherland Dr
- 1055 Sutherland Dr
- 1057 Sutherland Dr
- 1057 Sutherland Dr
- 1057 Sutherland Dr Unit 21
- 1057 Sutherland Dr Unit C
- 1059 Sutherland Dr
- 1059 Sutherland Dr Unit 20 C
- 1059 Sutherland Dr Unit C
- 1052 Sutherland Dr
- 1064 Sutherland Dr Unit 26 A
- 1064 Sutherland Dr