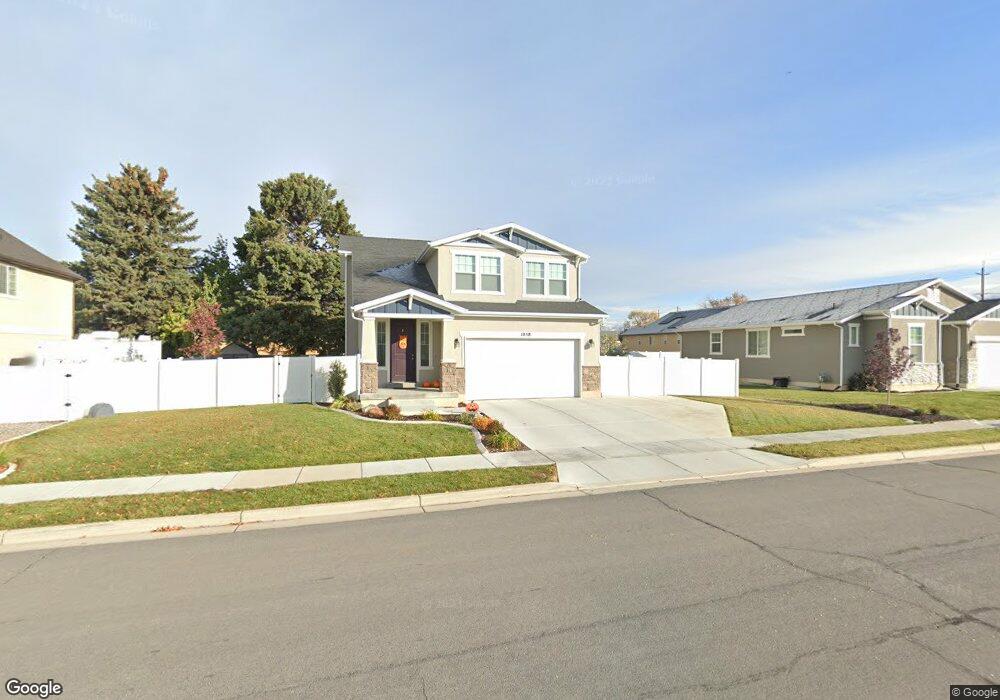
1058 W 750 S Unit 3 Clearfield, UT 84015
Estimated Value: $523,000 - $579,000
3
Beds
3
Baths
1,753
Sq Ft
$315/Sq Ft
Est. Value
About This Home
This home is located at 1058 W 750 S Unit 3, Clearfield, UT 84015 and is currently estimated at $551,340, approximately $314 per square foot. 1058 W 750 S Unit 3 is a home located in Davis County with nearby schools including Cook School, Syracuse Junior High School, and Syracuse High School.
Ownership History
Date
Name
Owned For
Owner Type
Purchase Details
Closed on
Sep 24, 2021
Sold by
Hansen Matthew Dean and Hansen Tracy
Bought by
Hansen Matthew D and Hansen Tracy
Current Estimated Value
Home Financials for this Owner
Home Financials are based on the most recent Mortgage that was taken out on this home.
Original Mortgage
$174,000
Outstanding Balance
$145,309
Interest Rate
2.8%
Mortgage Type
New Conventional
Estimated Equity
$406,031
Purchase Details
Closed on
May 9, 2018
Sold by
Ivory Homes Ltd
Bought by
Hansen Matthew Dean and Hansen Tracy
Home Financials for this Owner
Home Financials are based on the most recent Mortgage that was taken out on this home.
Original Mortgage
$193,700
Interest Rate
4.4%
Mortgage Type
New Conventional
Purchase Details
Closed on
Sep 6, 2007
Sold by
Us Development Inc
Bought by
Board Of Education Of Davis School Distr
Create a Home Valuation Report for This Property
The Home Valuation Report is an in-depth analysis detailing your home's value as well as a comparison with similar homes in the area
Home Values in the Area
Average Home Value in this Area
Purchase History
| Date | Buyer | Sale Price | Title Company |
|---|---|---|---|
| Hansen Matthew D | -- | Mountain View Title & Escrow | |
| Hansen Matthew D | -- | Mountain View Title & Escrow | |
| Hansen Matthew Dean | -- | -- | |
| Ivory Homes Ltd | -- | Cottonwood Title | |
| Board Of Education Of Davis School Distr | -- | Bonneville Superior Title Co |
Source: Public Records
Mortgage History
| Date | Status | Borrower | Loan Amount |
|---|---|---|---|
| Open | Hansen Matthew D | $174,000 | |
| Closed | Hansen Matthew D | $174,000 | |
| Previous Owner | Ivory Homes Ltd | $193,700 |
Source: Public Records
Tax History Compared to Growth
Tax History
| Year | Tax Paid | Tax Assessment Tax Assessment Total Assessment is a certain percentage of the fair market value that is determined by local assessors to be the total taxable value of land and additions on the property. | Land | Improvement |
|---|---|---|---|---|
| 2025 | $3,063 | $274,450 | $70,467 | $203,983 |
| 2024 | $2,931 | $264,550 | $67,383 | $197,167 |
| 2023 | $2,716 | $450,000 | $108,014 | $341,986 |
| 2022 | $3,106 | $278,300 | $62,138 | $216,162 |
| 2021 | $2,858 | $387,000 | $65,004 | $321,996 |
| 2020 | $2,484 | $334,000 | $54,492 | $279,508 |
| 2019 | $2,426 | $322,000 | $57,758 | $264,242 |
| 2018 | $487 | $62,957 | $48,703 | $14,254 |
| 2016 | $0 | $0 | $0 | $0 |
| 2015 | -- | $0 | $0 | $0 |
| 2014 | -- | $0 | $0 | $0 |
| 2013 | -- | $0 | $0 | $0 |
Source: Public Records
Map
Nearby Homes