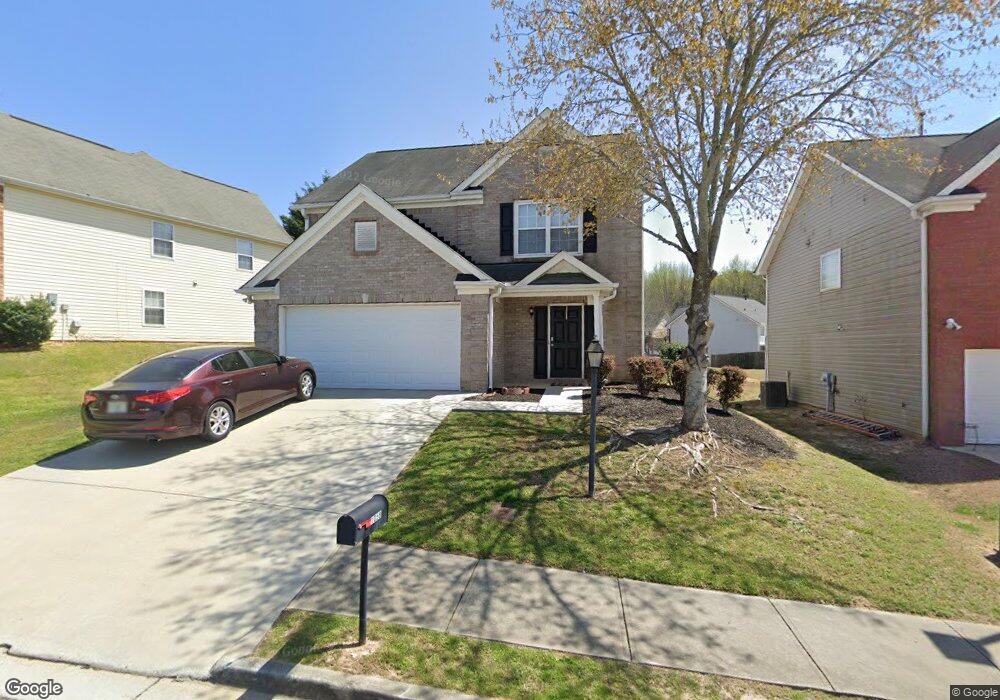
1058 Winding Down Way Unit 1 Grayson, GA 30017
Estimated Value: $333,000 - $367,000
4
Beds
3
Baths
2,070
Sq Ft
$168/Sq Ft
Est. Value
About This Home
This home is located at 1058 Winding Down Way Unit 1, Grayson, GA 30017 and is currently estimated at $348,091, approximately $168 per square foot. 1058 Winding Down Way Unit 1 is a home located in Gwinnett County with nearby schools including Trip Elementary School, Bay Creek Middle School, and Grayson High School.
Ownership History
Date
Name
Owned For
Owner Type
Purchase Details
Closed on
Jun 11, 2015
Sold by
Colfin Ai Ga 1 Llc
Bought by
Cah 2015 1 Borrower Llc
Current Estimated Value
Purchase Details
Closed on
Dec 4, 2012
Sold by
Kponi Baridilo
Bought by
Colfin Ai Ga 1 Llc
Purchase Details
Closed on
Jan 19, 2006
Sold by
Farmer Cindee V
Bought by
Kponi Baridilo
Home Financials for this Owner
Home Financials are based on the most recent Mortgage that was taken out on this home.
Original Mortgage
$31,900
Interest Rate
5.7%
Mortgage Type
Unknown
Purchase Details
Closed on
Dec 26, 2002
Sold by
Colony Homes Llc
Bought by
Farmer Cindee V
Home Financials for this Owner
Home Financials are based on the most recent Mortgage that was taken out on this home.
Original Mortgage
$140,550
Interest Rate
6.1%
Mortgage Type
FHA
Create a Home Valuation Report for This Property
The Home Valuation Report is an in-depth analysis detailing your home's value as well as a comparison with similar homes in the area
Home Values in the Area
Average Home Value in this Area
Purchase History
| Date | Buyer | Sale Price | Title Company |
|---|---|---|---|
| Cah 2015 1 Borrower Llc | -- | -- | |
| Colfin Ai Ga 1 Llc | -- | -- | |
| Kponi Baridilo | $159,500 | -- | |
| Farmer Cindee V | $141,800 | -- |
Source: Public Records
Mortgage History
| Date | Status | Borrower | Loan Amount |
|---|---|---|---|
| Previous Owner | Kponi Baridilo | $31,900 | |
| Previous Owner | Kponi Baridilo | $127,600 | |
| Previous Owner | Farmer Cindee V | $140,550 |
Source: Public Records
Tax History Compared to Growth
Tax History
| Year | Tax Paid | Tax Assessment Tax Assessment Total Assessment is a certain percentage of the fair market value that is determined by local assessors to be the total taxable value of land and additions on the property. | Land | Improvement |
|---|---|---|---|---|
| 2025 | $4,140 | $131,000 | $30,400 | $100,600 |
| 2024 | $4,192 | $131,000 | $30,400 | $100,600 |
| 2023 | $4,192 | $133,680 | $30,400 | $103,280 |
| 2022 | $2,524 | $78,640 | $16,800 | $61,840 |
| 2021 | $2,579 | $78,640 | $16,800 | $61,840 |
| 2020 | $2,559 | $78,640 | $16,800 | $61,840 |
| 2019 | $2,625 | $68,760 | $15,200 | $53,560 |
| 2018 | $2,427 | $63,240 | $12,000 | $51,240 |
| 2016 | $2,155 | $56,080 | $12,000 | $44,080 |
| 2015 | $1,956 | $50,600 | $9,600 | $41,000 |
| 2014 | $1,969 | $50,600 | $9,600 | $41,000 |
Source: Public Records
Map
Nearby Homes
- 1134 Stony Point
- 2797 Nathaniel Way
- 1028 Bramble Way
- 2018 Mitchell Farm Rd
- 958 Bramble Way
- 706 Hawthorn Ln Unit 3
- 1363 Cooper Springs Rd
- 2810 Cooper Brook Dr
- 1410 Ben Park Way
- 1388 Ben Park Way
- 2880 Cooper Brook Dr
- 1397 Ben Park Way
- 1391 Ben Park Way
- 1135 Pebble Bend Dr
- 2228 Roseberry Ln
- 2238 Roseberry Ln
- 2639 Cooper Brook Dr
- 2629 Cooper Brook Dr
- 1068 Winding Down Way
- 1048 Winding Down Way
- 1048 Winding Down Way Unit 1
- 1215 Stony Point Unit 2
- 1078 Winding Down Way
- 1038 Winding Down Way Unit 1
- 1205 Stony Point
- 2897 Nathaniel Way
- 1225 Stony Point
- 1028 Winding Down Way
- 1028 Winding Down Way
- 0 Winding Down Way Unit 7189953
- 0 Winding Down Way Unit 8093020
- 0 Winding Down Way Unit 7169097
- 0 Winding Down Way Unit 7056492
- 0 Winding Down Way Unit 3259601
- 0 Winding Down Way Unit 7159103
- 0 Winding Down Way
- 1041 Winding Down Way
- 2970 Storybook Ln