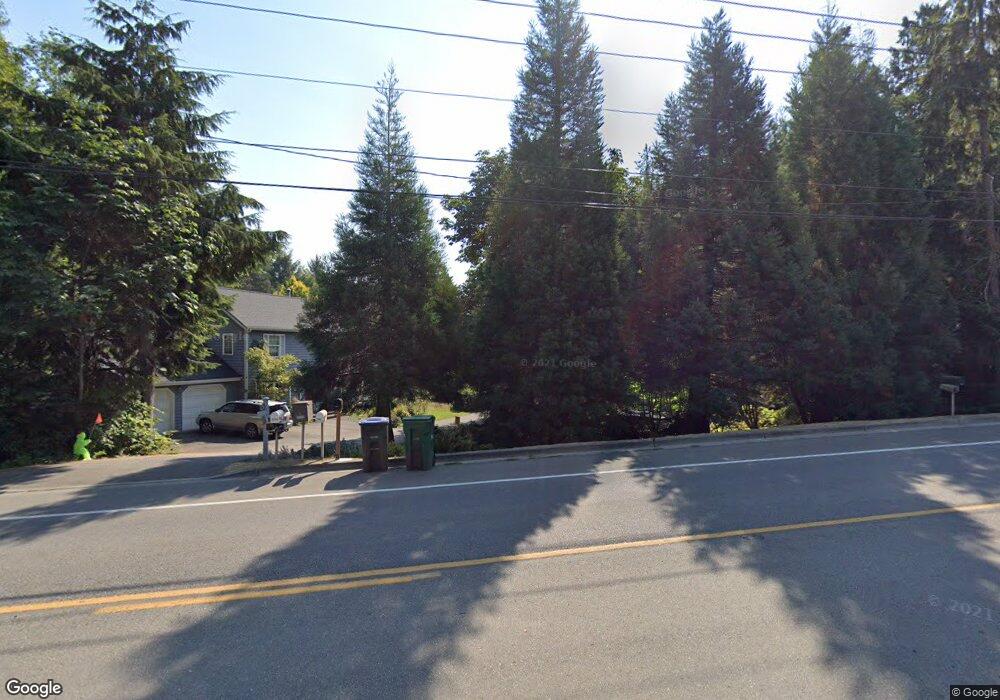
10581 NE West Kingston Rd Kingston, WA 98346
Kingston NeighborhoodEstimated Value: $532,049 - $678,000
2
Beds
2
Baths
1,355
Sq Ft
$456/Sq Ft
Est. Value
About This Home
This home is located at 10581 NE West Kingston Rd, Kingston, WA 98346 and is currently estimated at $617,762, approximately $455 per square foot. 10581 NE West Kingston Rd is a home located in Kitsap County with nearby schools including Richard Gordon Elementary School, Kingston Middle School, and Kingston High School.
Ownership History
Date
Name
Owned For
Owner Type
Purchase Details
Closed on
Oct 23, 2007
Sold by
Higa Bee
Bought by
Jones Joyce S
Current Estimated Value
Purchase Details
Closed on
Jul 30, 2004
Sold by
Vanhouten Stephen R and Vanhouten Melanie
Bought by
Higa Bee
Home Financials for this Owner
Home Financials are based on the most recent Mortgage that was taken out on this home.
Original Mortgage
$229,500
Interest Rate
8.2%
Mortgage Type
Purchase Money Mortgage
Purchase Details
Closed on
Apr 27, 2001
Sold by
Nelson Wallace E and Nelson Kathleen V
Bought by
Vanhouten Stephen R and Vanhouten Melanie
Home Financials for this Owner
Home Financials are based on the most recent Mortgage that was taken out on this home.
Original Mortgage
$177,650
Interest Rate
6.98%
Create a Home Valuation Report for This Property
The Home Valuation Report is an in-depth analysis detailing your home's value as well as a comparison with similar homes in the area
Home Values in the Area
Average Home Value in this Area
Purchase History
| Date | Buyer | Sale Price | Title Company |
|---|---|---|---|
| Jones Joyce S | $344,780 | Rainier Title Co | |
| Higa Bee | $255,000 | First American Title Ins | |
| Vanhouten Stephen R | $187,000 | Transnation Title Insurance |
Source: Public Records
Mortgage History
| Date | Status | Borrower | Loan Amount |
|---|---|---|---|
| Previous Owner | Higa Bee | $229,500 | |
| Previous Owner | Vanhouten Stephen R | $177,650 | |
| Closed | Higa Bee | $12,750 |
Source: Public Records
Tax History Compared to Growth
Tax History
| Year | Tax Paid | Tax Assessment Tax Assessment Total Assessment is a certain percentage of the fair market value that is determined by local assessors to be the total taxable value of land and additions on the property. | Land | Improvement |
|---|---|---|---|---|
| 2026 | $4,031 | $431,320 | $126,350 | $304,970 |
| 2025 | $4,031 | $435,030 | $112,820 | $322,210 |
| 2024 | $3,901 | $435,030 | $112,820 | $322,210 |
| 2023 | $3,696 | $405,420 | $98,280 | $307,140 |
| 2022 | $3,256 | $338,560 | $81,670 | $256,890 |
| 2021 | $3,042 | $288,410 | $69,210 | $219,200 |
| 2020 | $3,074 | $288,410 | $69,210 | $219,200 |
| 2019 | $2,564 | $239,200 | $56,870 | $182,330 |
| 2018 | $2,341 | $191,730 | $44,900 | $146,830 |
| 2017 | $2,343 | $191,730 | $44,900 | $146,830 |
| 2016 | $2,218 | $166,230 | $42,760 | $123,470 |
| 2015 | $2,202 | $166,230 | $42,760 | $123,470 |
| 2014 | -- | $159,690 | $42,760 | $116,930 |
| 2013 | -- | $162,400 | $55,660 | $106,740 |
Source: Public Records
Map
Nearby Homes
- 10295 NE West Kingston Rd
- 25960 Central Ave NE
- 0 Barber Cut Off Rd NE
- 26516 Lindvog Rd NE
- 28 xxx NE State Highway 104
- 26425 Pennsylvania Ave NE Unit A34
- 26787 Red Maple Ln NE
- 26435 Pennsylvania Ave NE Unit B-39
- 26468 Kingsview Loop NE
- 10563 NE Misty Glen Way
- 26702 Ohio Ave NE
- 24628 Hillbend Ln NE
- 24515 Madura Dr NE
- 24115 Madura Dr NE
- 23466 Marinwood Cir NE Unit 1412
- 23503 Marinwood Cir NE Unit 1112
- 9590 NE Leprechaun Ln
- 23491 Marinwood Cir NE Unit 1012
- 23419 Marinwood Cir NE Unit 512
- 23479 Marinwood Cir NE Unit 912
- 10567 NE West Kingston Rd
- 10583 NE West Kingston Rd
- 10593 NE West Kingston Rd
- 10587 NE West Kingston Rd
- 25965 Dunlin Ln NE
- 10575 NE West Kingston Rd
- 25953 Dunlin Ln NE
- 10545 NE West Kingston Rd
- 10599 NE West Kingston Rd
- 8996 NE West Kingston Rd
- 10521 NE West Kingston Rd
- 10533 NE West Kingston Rd
- 25977 Dunlin Ln NE
- 10633 NE West Kingston Rd
- 10509 NE West Kingston Rd
- 25989 Dunlin Ln NE
- 10493 NE West Kingston Rd
- 10550 NE West Kingston Rd
- 10497 NE West Kingston Rd
- 10528 NE West Kingston Rd