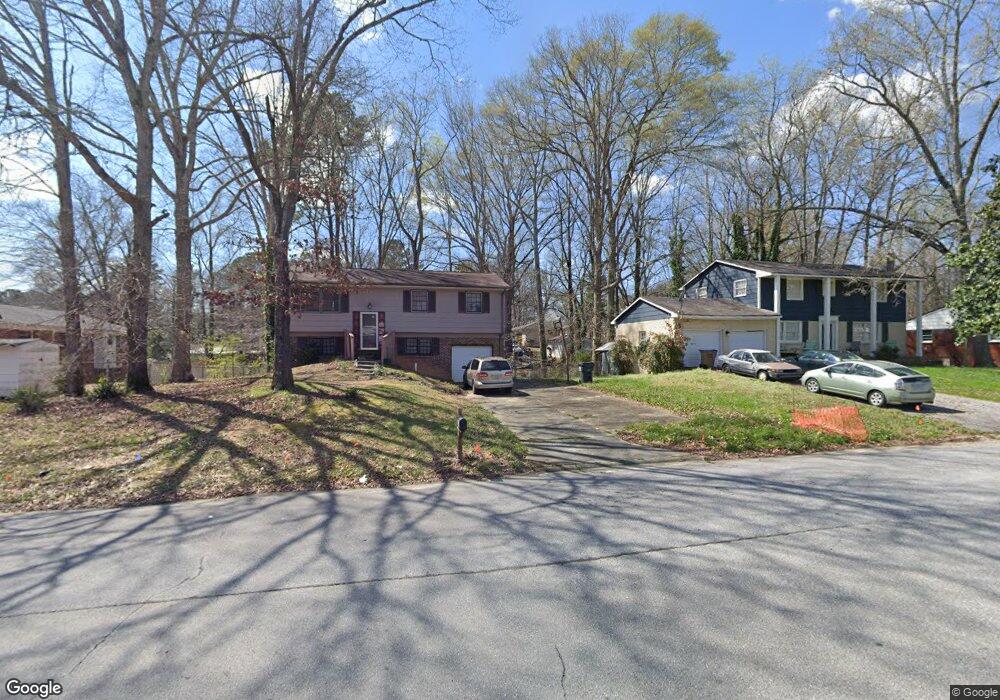
10583 Thrasher Rd Jonesboro, GA 30238
Estimated Value: $208,000 - $242,000
4
Beds
3
Baths
1,692
Sq Ft
$133/Sq Ft
Est. Value
About This Home
This home is located at 10583 Thrasher Rd, Jonesboro, GA 30238 and is currently estimated at $225,376, approximately $133 per square foot. 10583 Thrasher Rd is a home located in Clayton County with nearby schools including Kemp Primary School, Kemp Elementary School, and Lovejoy Middle School.
Ownership History
Date
Name
Owned For
Owner Type
Purchase Details
Closed on
Sep 21, 2009
Sold by
Federal Natl Mtg Assn Fnma
Bought by
Khazaw Shwan E
Current Estimated Value
Purchase Details
Closed on
Nov 5, 2008
Sold by
Countrywide Hm Loans Servicing
Bought by
Federal National Mortgage Association
Purchase Details
Closed on
Nov 15, 2004
Sold by
Tcif Reo1 Llc
Bought by
Seymour Patrick E and Seymour Amy
Home Financials for this Owner
Home Financials are based on the most recent Mortgage that was taken out on this home.
Original Mortgage
$98,400
Interest Rate
5.66%
Purchase Details
Closed on
Jan 6, 2004
Sold by
Jones Portia R and Jones Kirby
Bought by
Select Portfolio Svc Inc
Purchase Details
Closed on
Nov 15, 1996
Sold by
Spriggs Janet K
Bought by
Larollins Michele La
Create a Home Valuation Report for This Property
The Home Valuation Report is an in-depth analysis detailing your home's value as well as a comparison with similar homes in the area
Home Values in the Area
Average Home Value in this Area
Purchase History
| Date | Buyer | Sale Price | Title Company |
|---|---|---|---|
| Khazaw Shwan E | -- | -- | |
| Federal National Mortgage Association | -- | -- | |
| Countrywide Hm Loans Servicing | $110,687 | -- | |
| Seymour Patrick E | $85,400 | -- | |
| Select Portfolio Svc Inc | $101,888 | -- | |
| Larollins Michele La | $63,000 | -- |
Source: Public Records
Mortgage History
| Date | Status | Borrower | Loan Amount |
|---|---|---|---|
| Previous Owner | Seymour Patrick E | $98,400 |
Source: Public Records
Tax History Compared to Growth
Tax History
| Year | Tax Paid | Tax Assessment Tax Assessment Total Assessment is a certain percentage of the fair market value that is determined by local assessors to be the total taxable value of land and additions on the property. | Land | Improvement |
|---|---|---|---|---|
| 2024 | $2,185 | $66,000 | $7,200 | $58,800 |
| 2023 | $1,184 | $60,800 | $7,200 | $53,600 |
| 2022 | $1,430 | $46,440 | $7,200 | $39,240 |
| 2021 | $1,095 | $37,720 | $7,200 | $30,520 |
| 2020 | $873 | $31,837 | $7,200 | $24,637 |
| 2019 | $775 | $29,096 | $5,600 | $23,496 |
| 2018 | $433 | $20,656 | $5,600 | $15,056 |
| 2017 | $405 | $19,951 | $5,600 | $14,351 |
| 2016 | $491 | $22,072 | $5,600 | $16,472 |
| 2015 | $495 | $0 | $0 | $0 |
| 2014 | $375 | $19,402 | $5,600 | $13,802 |
Source: Public Records
Map
Nearby Homes
- 1646 Flicker Rd
- 1590 Flicker Rd
- 10448 Tara Pointe Dr
- 1739 Cardinal Rd
- 1486 Carriage Ln
- 10413 Trellis Ln Unit (LOT 33)
- 10429 Trellis Ln
- 10413 Trellis Ln
- 10425 Trellis Ln Unit (LOT 30)
- 10429 Trellis Ln Unit (LOT 29)
- 10453 Trellis Ln
- 10453 Trellis Ln Unit (LOT 28)
- 10410 Trellis Ln Unit (LOT 35)
- 10422 Trellis Ln Unit (LOT 38)
- 1685 Kinglet Rd
- 1447 Trellis Ct Unit (LOT 6)
- 1438 Starling Ct
- The Ryman Plan at Trellis Park
- The Benson II Plan at Trellis Park
- The Piedmont Plan at Trellis Park
- 10577 Thrasher Rd
- 1660 Turkey Ln
- 10590 Eagle Dr
- 10569 Thrasher Rd
- 1644 Turkey Ln
- 10584 Eagle Dr
- 10590 Thrasher Rd
- 10572 Thrasher Rd
- 10605 Thrasher Rd
- 10561 Thrasher Rd
- 10578 Eagle Dr
- 10612 Eagle Dr
- 10562 Thrasher Rd
- 1688 Thrasher Ct
- 10555 Thrasher Rd
- 10617 Thrasher Rd
- 10604 Thrasher Rd
- 10572 Eagle Dr
- 10618 Eagle Dr
- 10597 Eagle Dr