10589 E Canyon Oaks Way Claremore, OK 74017
Estimated Value: $361,251 - $394,000
3
Beds
3
Baths
2,619
Sq Ft
$145/Sq Ft
Est. Value
About This Home
This home is located at 10589 E Canyon Oaks Way, Claremore, OK 74017 and is currently estimated at $378,813, approximately $144 per square foot. 10589 E Canyon Oaks Way is a home located in Rogers County with nearby schools including Oologah-Talala Lower Elementary School, Oologah-Talala Upper Elementary School, and Oologah-Talala Middle School.
Ownership History
Date
Name
Owned For
Owner Type
Purchase Details
Closed on
Mar 2, 2020
Sold by
Cochran Raymond Eugene and Cochran Mary Karen
Bought by
Cochran Raymond Eugene and Cochran Mary Karen
Current Estimated Value
Purchase Details
Closed on
Apr 16, 2010
Sold by
Cambell Chris W
Bought by
Campbell Rebecca
Purchase Details
Closed on
Mar 8, 2010
Sold by
Campbell Rebecca
Bought by
Cartus Financial Corporation
Purchase Details
Closed on
May 16, 2008
Sold by
Cartusfinancial Corp
Bought by
Cochran Raymond Eugene and Cochran Mary Karen
Purchase Details
Closed on
Oct 24, 1996
Sold by
Hinson John Construction
Purchase Details
Closed on
Jul 18, 1996
Sold by
Hinson John Rentals Inc
Purchase Details
Closed on
May 8, 1996
Sold by
J Bar J Land & Cattle Ltd
Purchase Details
Closed on
Jan 20, 1994
Sold by
Hisaw Jack E
Create a Home Valuation Report for This Property
The Home Valuation Report is an in-depth analysis detailing your home's value as well as a comparison with similar homes in the area
Home Values in the Area
Average Home Value in this Area
Purchase History
| Date | Buyer | Sale Price | Title Company |
|---|---|---|---|
| Cochran Raymond Eugene | -- | None Available | |
| Campbell Rebecca | -- | None Available | |
| Cartus Financial Corporation | $200,000 | None Available | |
| Cochran Raymond Eugene | $200,000 | None Available | |
| -- | $127,000 | -- | |
| -- | -- | -- | |
| -- | $12,000 | -- | |
| -- | $196,000 | -- |
Source: Public Records
Tax History Compared to Growth
Tax History
| Year | Tax Paid | Tax Assessment Tax Assessment Total Assessment is a certain percentage of the fair market value that is determined by local assessors to be the total taxable value of land and additions on the property. | Land | Improvement |
|---|---|---|---|---|
| 2025 | $2,983 | $28,445 | $2,729 | $25,716 |
| 2024 | $2,802 | $27,616 | $2,649 | $24,967 |
| 2023 | $2,802 | $26,812 | $2,090 | $24,722 |
| 2022 | $2,605 | $26,031 | $2,016 | $24,015 |
| 2021 | $2,544 | $25,915 | $2,200 | $23,715 |
| 2020 | $2,504 | $25,162 | $1,650 | $23,512 |
| 2019 | $2,316 | $23,183 | $1,650 | $21,533 |
| 2018 | $2,478 | $23,939 | $1,650 | $22,289 |
| 2017 | $2,592 | $23,682 | $1,650 | $22,032 |
| 2016 | $2,299 | $23,070 | $1,650 | $21,420 |
| 2015 | $2,318 | $24,696 | $1,650 | $23,046 |
| 2014 | $2,168 | $23,046 | $1,650 | $21,396 |
Source: Public Records
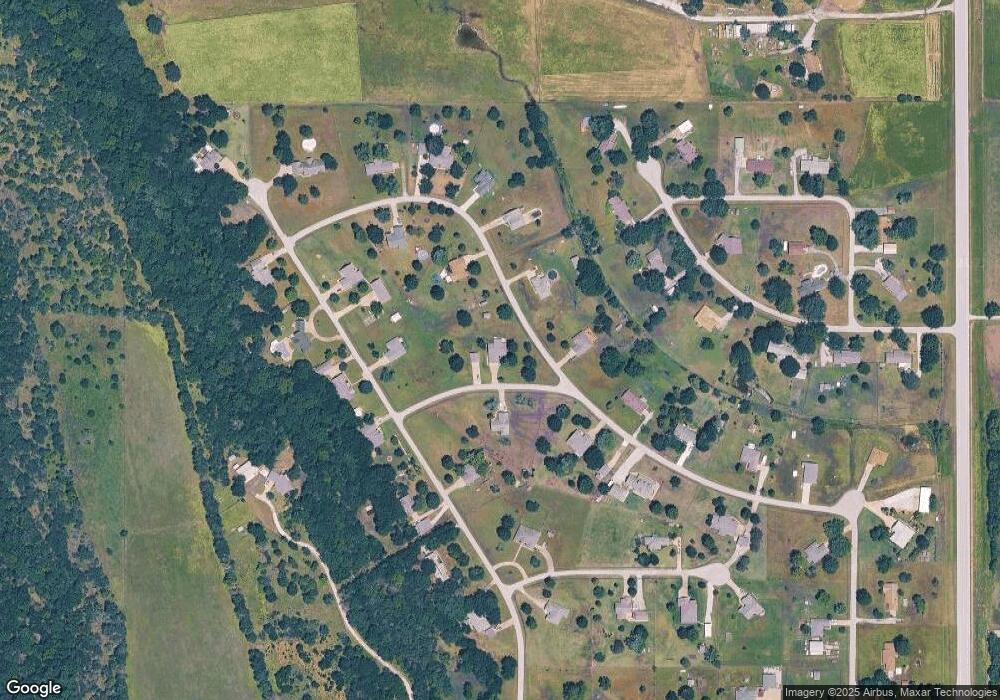
Map
Nearby Homes
- 10922 E Canyon Oaks Blvd
- 0 S 4130 Rd
- 10308 E 445 Rd
- 10192 E 445 Rd
- 9462 E Yorkshire Ave
- 10520 E 450 Rd
- 10860 E 450 Rd
- 15750 S Old Highway 88
- 11971 Stonehedge Dr
- 11901 Laurel Ln
- 13525 S Grande Pointe Pkwy
- 9885 E Mesa Dr
- 13266 S Spruce Ln
- 13192 S Hickory St
- 9666 E Sycamore St
- 17811 S 4150 Rd
- 18182 S Ratliff Ct
- 10036 S Ratliff Ct
- 9910 E Shadowlake Ln
- 9452 E 460 Rd
- 10600 Canyon Oaks Way
- 10589 E Canyon Oaks Way
- 10588 E Canyon Oaks Way
- 10595 E Canyon Oaks Blvd
- 10566 E Canyon Oaks Blvd
- 15777 S Canyon Oaks Ln
- 10655 E Canyon Oaks Blvd
- 0 S Canyon Oaks Ln
- 10700 E Canyon Oaks Blvd
- 15805 S Canyon Oaks Ln
- 10585 E Canyon Oaks Blvd
- 10494 E Canyon Oaks Blvd
- 15750 S Canyon Oaks Ln
- 15730 S Canyon Oaks Ln
- 10711 E Canyon Oaks Blvd
- 15707 S Canyon Oaks Ln
- 10842 E Canyon Oaks Place
- 10601 E Canyon Oaks Ct
- 10533 E Canyon Oaks Blvd
- 10533 E Canyon Oaks Blvd