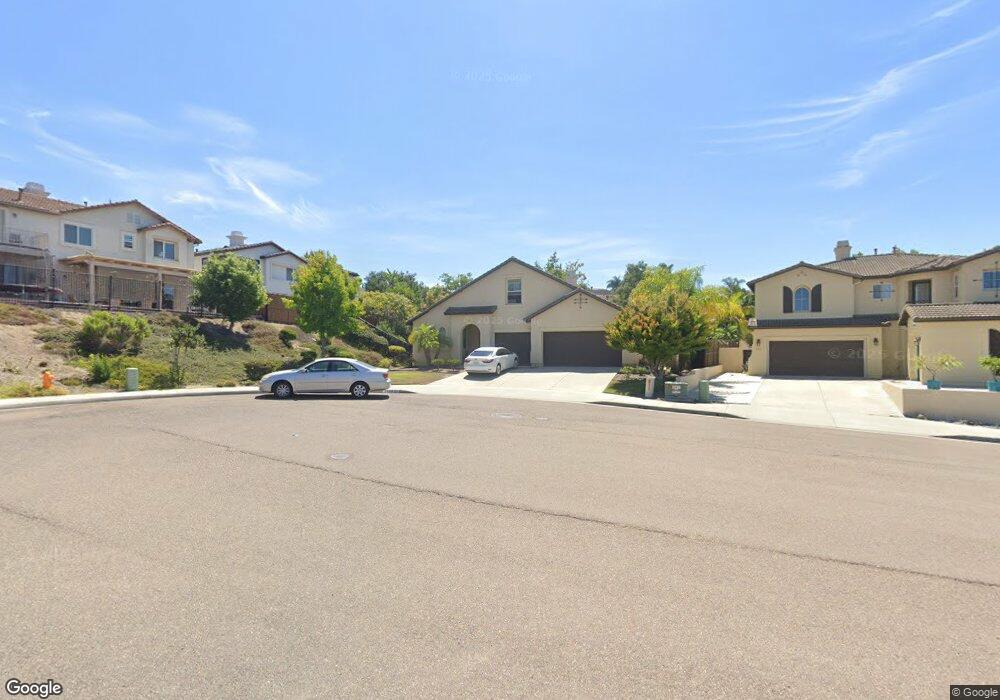
1059 Fields Ct Oceanside, CA 92057
North Valley NeighborhoodEstimated Value: $1,104,000 - $1,223,000
About This Home
This home is located at 1059 Fields Ct, Oceanside, CA 92057 and is currently estimated at $1,181,273, approximately $391 per square foot. 1059 Fields Ct is a home located in San Diego County with nearby schools including Bonsall West Elementary School, Sullivan Middle School, and Bonsall High.
Ownership History
We collect this data history from publicly available records. To have your information removed, we recommend requesting removal directly through your county’s website.
Purchase Details
Purchase Details
Home Financials for this Owner
Home Financials are based on the most recent Mortgage that was taken out on this home.Purchase Details
Home Financials for this Owner
Home Financials are based on the most recent Mortgage that was taken out on this home.Home Values in the Area
Average Home Value in this Area
Purchase History
We collect this data history from publicly available records. To have your information removed, we recommend requesting removal directly through your county’s website.
| Date | Buyer | Sale Price | Title Company |
|---|---|---|---|
| -- | None Available | ||
| -- | Ticor Title Company | ||
| $602,000 | First Amer Title Sub Saleout |
Mortgage History
We collect this data history from publicly available records. To have your information removed, we recommend requesting removal directly through your county’s website.
| Date | Status | Borrower | Loan Amount |
|---|---|---|---|
| Open | $430,000 | ||
| Closed | $480,000 |
Tax History
We collect this data history from publicly available records. To have your information removed, we recommend requesting removal directly through your county’s website.
| Year | Tax Paid | Tax Assessment Tax Assessment Total Assessment is a certain percentage of the fair market value that is determined by local assessors to be the total taxable value of land and additions on the property. | Land | Improvement |
|---|---|---|---|---|
| 2025 | $10,532 | $806,157 | $401,910 | $404,247 |
| 2024 | $10,532 | $790,351 | $394,030 | $396,321 |
| 2023 | $10,305 | $774,854 | $386,304 | $388,550 |
| 2022 | $10,163 | $759,662 | $378,730 | $380,932 |
| 2021 | $10,019 | $744,767 | $371,304 | $373,463 |
| 2020 | $9,251 | $670,000 | $299,000 | $371,000 |
| 2019 | $8,940 | $640,000 | $286,000 | $354,000 |
| 2018 | $8,997 | $630,000 | $282,000 | $348,000 |
| 2017 | $8,646 | $575,000 | $258,000 | $317,000 |
| 2016 | $8,402 | $550,000 | $247,000 | $303,000 |
| 2015 | $8,489 | $550,000 | $247,000 | $303,000 |
| 2014 | $8,043 | $500,000 | $225,000 | $275,000 |
Map
- 1080 Breakaway Dr
- 1093 Breakaway Dr
- 1018 Bellingham Dr
- 5125 Eliot St
- 980 Manteca Dr
- 795 Via Callado
- 5022 Calle Arquero
- 5177 Bluegrass Way
- 905 Glendora Dr
- 5229 Harvest Ct
- 1268 Bellingham Dr
- 5179 Via Mindanao
- 4901 Tropea St Unit II
- 1077 Village Dr
- 1491 Puritan Way
- 1486 Puritan Dr
- 671 Parker St
- 5146 E Parker St
- 656 Parker St
- 0 Indian View Dr
- 1055 Fields Ct
- 1157 Parkview Dr
- 1153 Parkview Dr
- 1149 Parkview Dr
- 1051 Fields Ct
- 1050 Fields Ct
- 1054 Fields Ct
- 1161 Parkview Dr
- 1145 Parkview Dr
- 1165 Parkview Dr
- 1169 Parkview Dr
- 1156 Parkview Dr
- 1173 Parkview Dr
- 1152 Parkview Dr
- 1033 Sundial Ct
- 1029 Sundial Ct
- 1037 Sundial Ct
- 1148 Parkview Dr
- 1177 Parkview Dr
- 1025 Sundial Ct
Ask me questions while you tour the home.