Estimated Value: $199,000 - $219,677
4
Beds
2
Baths
1,373
Sq Ft
$153/Sq Ft
Est. Value
About This Home
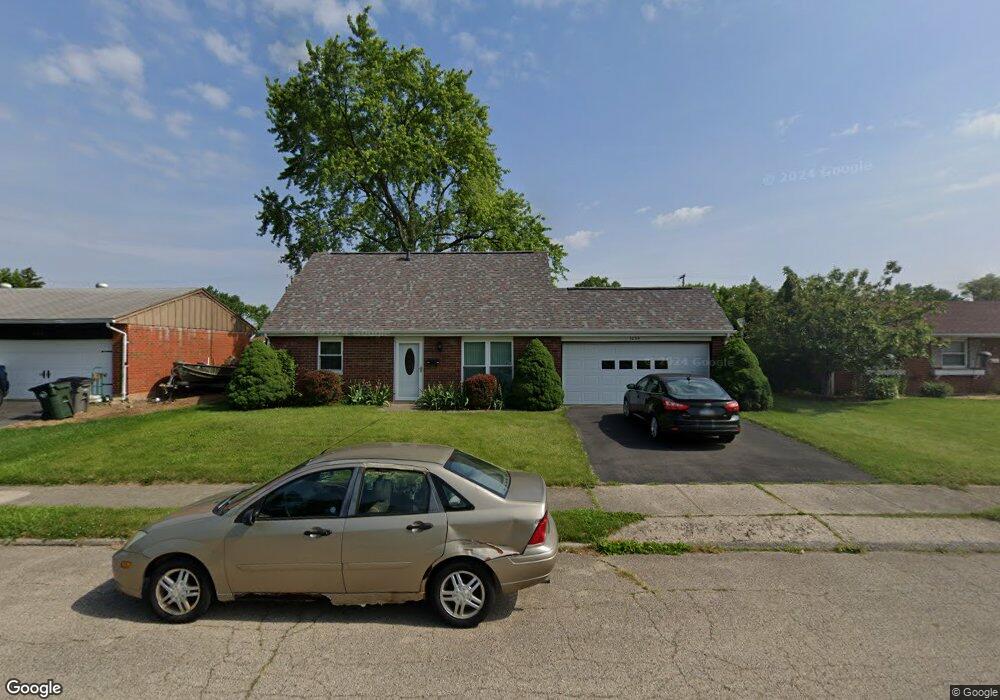
This home is located at 1059 N Mystic Ln, Troy, OH 45373 and is currently estimated at $209,919, approximately $152 per square foot. 1059 N Mystic Ln is a home located in Miami County with nearby schools including Cookson Elementary School, Troy Junior High School, and Van Cleve Elementary School.
Ownership History
Date
Name
Owned For
Owner Type
Purchase Details
Closed on
Jul 8, 2011
Sold by
Walker Shirley
Bought by
Best Jeffrey Allen
Current Estimated Value
Home Financials for this Owner
Home Financials are based on the most recent Mortgage that was taken out on this home.
Original Mortgage
$74,999
Outstanding Balance
$51,888
Interest Rate
4.63%
Mortgage Type
New Conventional
Estimated Equity
$158,031
Purchase Details
Closed on
Jun 29, 2011
Sold by
Walker Shirley
Bought by
Best Jeffrey Allen
Home Financials for this Owner
Home Financials are based on the most recent Mortgage that was taken out on this home.
Original Mortgage
$74,999
Outstanding Balance
$51,888
Interest Rate
4.63%
Mortgage Type
New Conventional
Estimated Equity
$158,031
Purchase Details
Closed on
Dec 5, 2001
Sold by
Drake Howard W and Drake Ruby M
Bought by
Drake Howard W and Drake Ruby M
Purchase Details
Closed on
Jan 1, 1990
Bought by
Drake Howard W
Create a Home Valuation Report for This Property
The Home Valuation Report is an in-depth analysis detailing your home's value as well as a comparison with similar homes in the area
Home Values in the Area
Average Home Value in this Area
Purchase History
| Date | Buyer | Sale Price | Title Company |
|---|---|---|---|
| Best Jeffrey Allen | $93,900 | -- | |
| Best Jeffrey Allen | $93,900 | -- | |
| Drake Howard W | -- | -- | |
| Drake Howard W | -- | -- |
Source: Public Records
Mortgage History
| Date | Status | Borrower | Loan Amount |
|---|---|---|---|
| Open | Drake Howard W | $74,999 | |
| Closed | Best Jeffrey Allen | $74,999 |
Source: Public Records
Tax History Compared to Growth
Tax History
| Year | Tax Paid | Tax Assessment Tax Assessment Total Assessment is a certain percentage of the fair market value that is determined by local assessors to be the total taxable value of land and additions on the property. | Land | Improvement |
|---|---|---|---|---|
| 2024 | $1,878 | $49,810 | $12,320 | $37,490 |
| 2023 | $1,878 | $49,810 | $12,320 | $37,490 |
| 2022 | $1,564 | $49,810 | $12,320 | $37,490 |
| 2021 | $1,267 | $38,330 | $9,490 | $28,840 |
| 2020 | $1,269 | $38,330 | $9,490 | $28,840 |
| 2019 | $1,280 | $38,330 | $9,490 | $28,840 |
| 2018 | $1,233 | $35,530 | $10,050 | $25,480 |
| 2017 | $1,245 | $35,530 | $10,050 | $25,480 |
| 2016 | $1,227 | $35,530 | $10,050 | $25,480 |
| 2015 | $1,209 | $33,540 | $9,490 | $24,050 |
| 2014 | $1,209 | $33,540 | $9,490 | $24,050 |
| 2013 | $1,216 | $33,540 | $9,490 | $24,050 |
Source: Public Records
Map
Nearby Homes
- 1002 Stonyridge Ave
- 1310 Saratoga Dr
- 429 Forrest Ln
- 1075 Crestview Dr
- 1329 Lee Rd
- 605 Ohio Ave
- 1947 Woodcliffe Dr
- 731 Michigan Ave
- 1760 Hunters Ridge Dr
- 1500 Paradise Trail
- 708 N Market St
- 1400 Troy Urbana Rd
- 190 Robin Hood Ln
- 1160 Waterloo St
- 1164 Waterloo St
- 1188 E Bentley Cir
- 755 W Bentley Cir
- 221 Finsbury Ln
- 1137 Auburn St
- 1102 E Franklin St
- 1059 Mystic Ln N
- 1051 Mystic Ln N
- 1067 Mystic Ln N
- 1043 Mystic Ln N
- 1075 Mystic Ln N
- 1060 Mystic Ln N
- 1150 Longwood Dr
- 1132 Longwood Dr
- 1068 Mystic Ln N
- 1168 Longwood Dr
- 1114 Longwood Dr
- 1044 Mystic Ln N
- 1076 Mystic Ln N
- 1035 N Mystic Ln
- 1035 Mystic Ln N
- 1083 Mystic Ln N
- 1184 Longwood Dr
- 1102 Longwood Dr
- 1036 N Mystic Ln
- 1084 N Mystic Ln