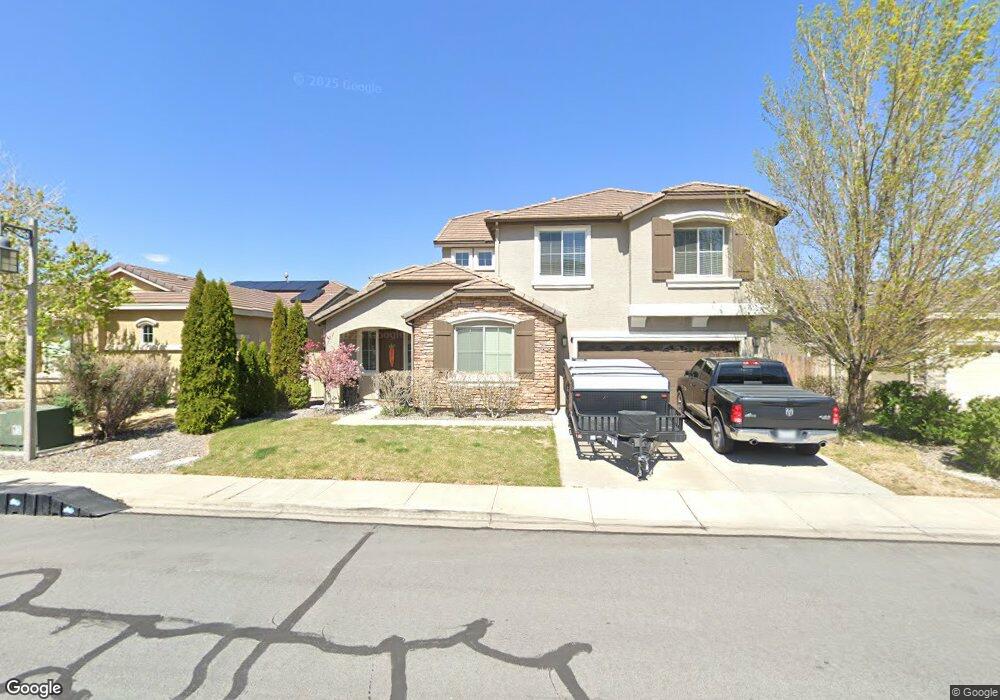
10593 Blockade Dr Reno, NV 89521
Virginia Foothills NeighborhoodEstimated Value: $704,000 - $760,000
4
Beds
3
Baths
2,481
Sq Ft
$292/Sq Ft
Est. Value
About This Home
This home is located at 10593 Blockade Dr, Reno, NV 89521 and is currently estimated at $725,538, approximately $292 per square foot. 10593 Blockade Dr is a home located in Washoe County with nearby schools including Jwood Raw Elementary School, Kendyl Depoali Middle School, and Damonte Ranch High School.
Ownership History
Date
Name
Owned For
Owner Type
Purchase Details
Closed on
Nov 10, 2023
Sold by
Pearson Christina
Bought by
Pearson Evan
Current Estimated Value
Purchase Details
Closed on
Sep 21, 2010
Sold by
Bernier Jeffrey A and Bernier Rebecca C
Bought by
Pearson Evan L and Pearson Christina M
Home Financials for this Owner
Home Financials are based on the most recent Mortgage that was taken out on this home.
Original Mortgage
$246,678
Interest Rate
4.37%
Mortgage Type
FHA
Purchase Details
Closed on
May 19, 2005
Sold by
Reynen & Bardis Damonte Llc
Bought by
Bernier Jeffrey A and Bernier Rebecca C
Home Financials for this Owner
Home Financials are based on the most recent Mortgage that was taken out on this home.
Original Mortgage
$338,860
Interest Rate
5.25%
Mortgage Type
Fannie Mae Freddie Mac
Create a Home Valuation Report for This Property
The Home Valuation Report is an in-depth analysis detailing your home's value as well as a comparison with similar homes in the area
Home Values in the Area
Average Home Value in this Area
Purchase History
| Date | Buyer | Sale Price | Title Company |
|---|---|---|---|
| Pearson Evan | -- | None Listed On Document | |
| Pearson Evan L | $250,000 | Western Title Company | |
| Bernier Jeffrey A | $424,000 | First American Title |
Source: Public Records
Mortgage History
| Date | Status | Borrower | Loan Amount |
|---|---|---|---|
| Previous Owner | Pearson Evan L | $246,678 | |
| Previous Owner | Bernier Jeffrey A | $338,860 |
Source: Public Records
Tax History
| Year | Tax Paid | Tax Assessment Tax Assessment Total Assessment is a certain percentage of the fair market value that is determined by local assessors to be the total taxable value of land and additions on the property. | Land | Improvement |
|---|---|---|---|---|
| 2026 | $1,959 | $157,366 | $47,600 | $109,766 |
| 2025 | $2,853 | $156,264 | $44,800 | $111,464 |
| 2024 | $2,853 | $151,865 | $39,690 | $112,175 |
| 2023 | $2,770 | $152,432 | $46,235 | $106,197 |
| 2022 | $3,596 | $123,530 | $35,210 | $88,320 |
| 2021 | $3,492 | $117,429 | $29,715 | $87,714 |
| 2020 | $3,283 | $117,524 | $29,715 | $87,809 |
| 2019 | $3,187 | $112,725 | $27,300 | $85,425 |
| 2018 | $3,094 | $103,874 | $20,370 | $83,504 |
| 2017 | $3,004 | $102,904 | $19,390 | $83,514 |
| 2016 | $2,928 | $103,167 | $17,920 | $85,247 |
| 2015 | $2,922 | $99,358 | $14,385 | $84,973 |
| 2014 | $2,836 | $96,364 | $14,665 | $81,699 |
| 2013 | -- | $75,079 | $11,550 | $63,529 |
Source: Public Records
Map
Nearby Homes
- 10755 Copper Lake Dr
- 10663 Fort Morgan Way
- 8005 Desert Sapling Dr Unit Homesite 2662
- 10025 Hampton Park Dr
- 10700 Summer Glen Dr
- 2655 Friesian Ct
- 2375 Lincoln Meadows Dr
- 1960 Dark Horse Rd Unit A
- 2032 Wind Ranch Rd Unit B
- 2426 Silver Maple Dr
- 1995 Wind Ranch Rd Unit B
- 2295 Trakehner Ln
- 1914 Sea Horse Rd Unit C
- 1915 Sea Horse Rd Unit B
- 2650 Fury Ct
- 10108 Gold Mine Dr
- 9785 Hafflinger Ln
- 1885 Sea Horse Rd Unit B
- 10806 Barrel Horse Ln
- 2220 Arpagos Ln
- 10595 Blockade Dr
- 10591 Blockade Dr
- 10597 Blockade Dr
- 10581 Blockade Dr
- 2505 Perryville Dr
- 10571 Blockade Dr
- 2500 Perryville Dr
- 2510 Seven Pines Ct
- 10625 Fire Poppy Cir
- 10627 Fire Poppy Cir
- 10561 Blockade Dr
- 2520 Seven Pines Ct
- 2510 Perryville Dr
- 2525 Perryville Dr
- 10629 Fire Poppy Cir
- 10617 Fire Poppy Cir
- 2520 Perryville Dr
- 10551 Blockade Dr
- 10613 Fire Poppy Cir
- 10560 Blockade Dr
Your Personal Tour Guide
Ask me questions while you tour the home.