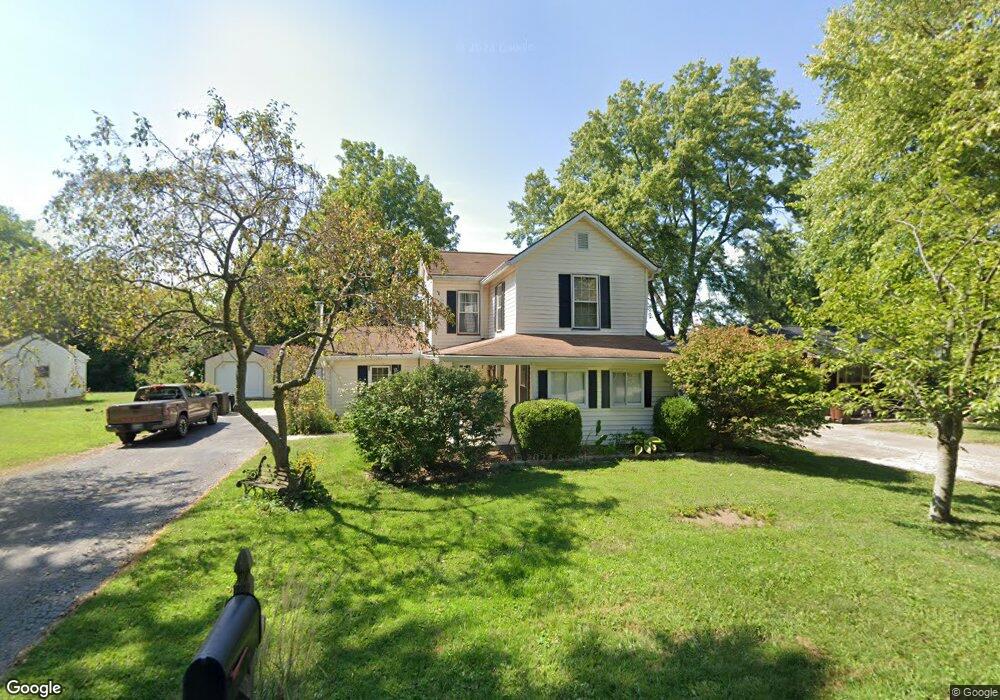
10599 Camden College Corner Rd College Corner, OH 45003
Estimated Value: $156,615 - $204,000
3
Beds
1
Bath
1,782
Sq Ft
$101/Sq Ft
Est. Value
About This Home
This home is located at 10599 Camden College Corner Rd, College Corner, OH 45003 and is currently estimated at $179,404, approximately $100 per square foot. 10599 Camden College Corner Rd is a home located in Preble County with nearby schools including College Corner Union Elementary School.
Ownership History
Date
Name
Owned For
Owner Type
Purchase Details
Closed on
May 31, 2007
Sold by
Clark Matthew M and Clark Melanie H
Bought by
Clark Bradley W and Clark Crystal R
Current Estimated Value
Home Financials for this Owner
Home Financials are based on the most recent Mortgage that was taken out on this home.
Original Mortgage
$84,600
Outstanding Balance
$51,850
Interest Rate
6.22%
Mortgage Type
Stand Alone Refi Refinance Of Original Loan
Estimated Equity
$127,554
Purchase Details
Closed on
Oct 22, 2004
Sold by
Jones Carla A
Bought by
Clark Matthew M and Clark Melanie H
Home Financials for this Owner
Home Financials are based on the most recent Mortgage that was taken out on this home.
Original Mortgage
$75,200
Interest Rate
5.93%
Mortgage Type
Purchase Money Mortgage
Purchase Details
Closed on
May 16, 1989
Bought by
Clark Bradley W and Clark Crystal R
Create a Home Valuation Report for This Property
The Home Valuation Report is an in-depth analysis detailing your home's value as well as a comparison with similar homes in the area
Home Values in the Area
Average Home Value in this Area
Purchase History
| Date | Buyer | Sale Price | Title Company |
|---|---|---|---|
| Clark Bradley W | $94,000 | Southwestern Ohio Title Agen | |
| Clark Matthew M | $94,000 | Southwestern Ohio Title Agen | |
| Clark Bradley W | $35,000 | -- |
Source: Public Records
Mortgage History
| Date | Status | Borrower | Loan Amount |
|---|---|---|---|
| Open | Clark Bradley W | $84,600 | |
| Previous Owner | Clark Matthew M | $75,200 |
Source: Public Records
Tax History Compared to Growth
Tax History
| Year | Tax Paid | Tax Assessment Tax Assessment Total Assessment is a certain percentage of the fair market value that is determined by local assessors to be the total taxable value of land and additions on the property. | Land | Improvement |
|---|---|---|---|---|
| 2024 | $1,336 | $42,280 | $5,110 | $37,170 |
| 2023 | $1,336 | $42,280 | $5,110 | $37,170 |
| 2022 | $1,157 | $32,700 | $4,030 | $28,670 |
| 2021 | $1,224 | $32,700 | $4,030 | $28,670 |
| 2020 | $1,169 | $32,700 | $4,030 | $28,670 |
| 2019 | $829 | $22,830 | $3,750 | $19,080 |
| 2018 | $859 | $22,830 | $3,750 | $19,080 |
| 2017 | $759 | $22,830 | $3,750 | $19,080 |
| 2016 | $873 | $25,730 | $3,640 | $22,090 |
| 2014 | $862 | $25,730 | $3,640 | $22,090 |
| 2013 | $907 | $25,725 | $3,640 | $22,085 |
Source: Public Records
Map
Nearby Homes
- 212 Shideler St
- 106 County Line Rd
- 4 Main St
- 515 Liberty Ave
- 8961 Walnut St
- 400 Brookville St
- 209 Main St
- 400 Union St
- 218 Brookville St
- 5395 Brookville Pike
- 5722 E Township Line Rd
- 4122 E Solar Dr
- 2349 U S 27
- 7870 Contreras Rd
- 6529 Todd Rd
- 215 Country Club Dr
- 5700 Forest Ridge Dr
- 9 Angela Ct
- 4 Olde Stone Ct
- 7755 Fairfield Rd
- 317 Eaton St
- 10597 Camden College Corner Rd
- 315 Eaton St
- 10610 Camden Colg Corn Rd Unit ROA
- 10610 Camden College Corner Rd
- 10595 Camden College Corner Rd
- 10600 Camden College Corner Rd
- 313 Eaton St
- 314 Eaton St
- 10593 Camden College Corner Rd
- 310 Eaton St
- 11872 Indiana St
- 311 Eaton St
- 308 Eaton St
- 10591 Camden College Corner Rd
- 3 Indiana St
- 11906 Indiana St
- 306 Eaton St
- 11914 Indiana St Unit 354
- 11882 Stateline Rd