105R Summer St Hingham, MA 02043
Estimated Value: $2,138,000 - $2,578,000
5
Beds
6
Baths
3,896
Sq Ft
$597/Sq Ft
Est. Value
About This Home
This home is located at 105R Summer St, Hingham, MA 02043 and is currently estimated at $2,324,511, approximately $596 per square foot. 105R Summer St is a home with nearby schools including East Elementary School, Hingham Middle School, and Hingham High School.
Ownership History
Date
Name
Owned For
Owner Type
Purchase Details
Closed on
Jul 1, 2024
Sold by
Shields Clark and Shields Amanda
Bought by
105 Summer St Rt and Shields
Current Estimated Value
Purchase Details
Closed on
Jul 31, 2015
Sold by
Evelyn F Hitchcock Ret and Moreno
Bought by
Shields Amanda and Sheilds Clark
Home Financials for this Owner
Home Financials are based on the most recent Mortgage that was taken out on this home.
Original Mortgage
$1,100,000
Interest Rate
3%
Mortgage Type
Adjustable Rate Mortgage/ARM
Purchase Details
Closed on
Aug 3, 2004
Sold by
Hitchcock Evelyn F
Bought by
Evelyn F Hitchcock Rt and Hitchcock Evelyn F
Create a Home Valuation Report for This Property
The Home Valuation Report is an in-depth analysis detailing your home's value as well as a comparison with similar homes in the area
Purchase History
| Date | Buyer | Sale Price | Title Company |
|---|---|---|---|
| 105 Summer St Rt | -- | None Available | |
| 105 Summer St Rt | -- | None Available | |
| Shields Amanda | $1,165,000 | -- | |
| Evelyn F Hitchcock Rt | -- | -- | |
| Shields Amanda | $1,165,000 | -- | |
| Evelyn F Hitchcock Rt | -- | -- |
Source: Public Records
Mortgage History
| Date | Status | Borrower | Loan Amount |
|---|---|---|---|
| Previous Owner | Shields Amanda | $1,100,000 |
Source: Public Records
Tax History
| Year | Tax Paid | Tax Assessment Tax Assessment Total Assessment is a certain percentage of the fair market value that is determined by local assessors to be the total taxable value of land and additions on the property. | Land | Improvement |
|---|---|---|---|---|
| 2025 | $21,618 | $2,022,300 | $950,500 | $1,071,800 |
| 2024 | $20,687 | $1,906,600 | $950,500 | $956,100 |
| 2023 | $18,279 | $1,827,900 | $950,500 | $877,400 |
| 2022 | $17,020 | $1,472,300 | $761,500 | $710,800 |
| 2021 | $16,389 | $1,388,900 | $761,500 | $627,400 |
| 2020 | $16,014 | $1,388,900 | $761,500 | $627,400 |
| 2019 | $15,965 | $1,351,800 | $761,500 | $590,300 |
| 2018 | $15,911 | $1,351,800 | $761,500 | $590,300 |
| 2017 | $13,386 | $1,092,700 | $729,200 | $363,500 |
| 2016 | $13,251 | $1,060,900 | $697,400 | $363,500 |
| 2015 | $12,971 | $1,035,200 | $689,100 | $346,100 |
Source: Public Records
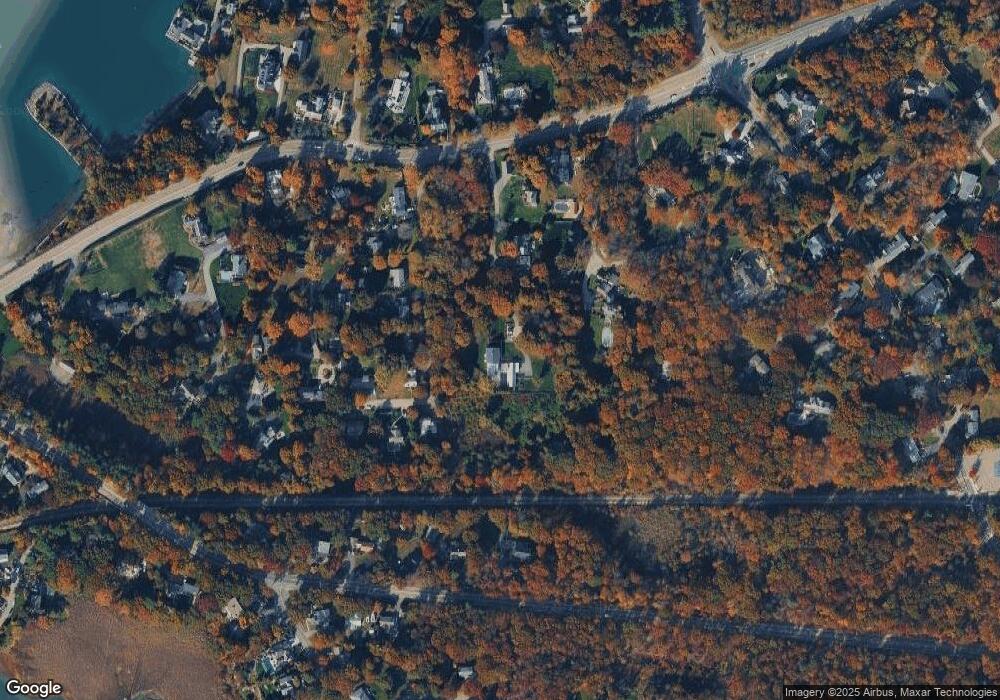
Map
Nearby Homes
Your Personal Tour Guide
Ask me questions while you tour the home.