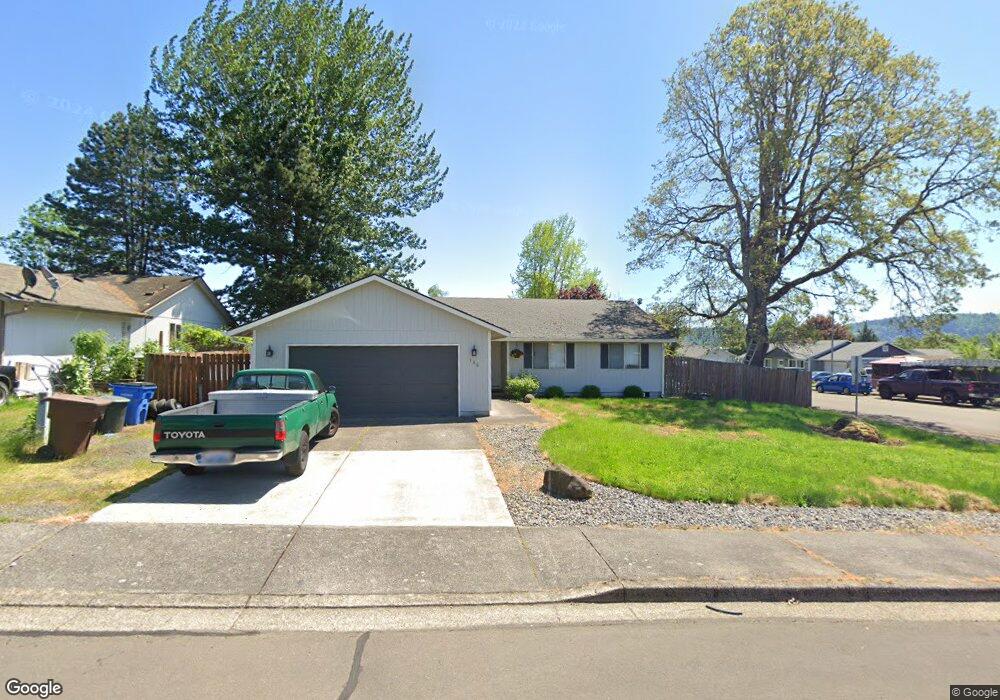
106 41st Ct Washougal, WA 98671
Estimated Value: $429,000 - $465,000
3
Beds
2
Baths
1,470
Sq Ft
$303/Sq Ft
Est. Value
About This Home
This home is located at 106 41st Ct, Washougal, WA 98671 and is currently estimated at $445,342, approximately $302 per square foot. 106 41st Ct is a home located in Clark County with nearby schools including Columbia River Gorge Elementary School, Jemtegaard Middle School, and Washougal High School.
Ownership History
Date
Name
Owned For
Owner Type
Purchase Details
Closed on
Aug 27, 2025
Sold by
Franke Hans W and Franke John W
Bought by
Franke Hans W
Current Estimated Value
Home Financials for this Owner
Home Financials are based on the most recent Mortgage that was taken out on this home.
Original Mortgage
$299,145
Interest Rate
4.75%
Mortgage Type
FHA
Purchase Details
Closed on
Sep 6, 2005
Sold by
Franke John W
Bought by
Franke John W and Franke Angela
Home Financials for this Owner
Home Financials are based on the most recent Mortgage that was taken out on this home.
Original Mortgage
$195,000
Interest Rate
5.7%
Mortgage Type
New Conventional
Purchase Details
Closed on
Jun 20, 2002
Sold by
Baker Fred E and Baker Dana E
Bought by
Franke John W
Home Financials for this Owner
Home Financials are based on the most recent Mortgage that was taken out on this home.
Original Mortgage
$106,800
Interest Rate
6.86%
Create a Home Valuation Report for This Property
The Home Valuation Report is an in-depth analysis detailing your home's value as well as a comparison with similar homes in the area
Purchase History
| Date | Buyer | Sale Price | Title Company |
|---|---|---|---|
| Franke Hans W | $313 | None Listed On Document | |
| Franke John W | -- | Stewart Title | |
| Franke John W | $133,500 | Chicago Title Insurance |
Source: Public Records
Mortgage History
| Date | Status | Borrower | Loan Amount |
|---|---|---|---|
| Previous Owner | Franke Hans W | $299,145 | |
| Previous Owner | Franke John W | $195,000 | |
| Previous Owner | Franke John W | $106,800 | |
| Closed | Franke John W | $26,700 |
Source: Public Records
Tax History
| Year | Tax Paid | Tax Assessment Tax Assessment Total Assessment is a certain percentage of the fair market value that is determined by local assessors to be the total taxable value of land and additions on the property. | Land | Improvement |
|---|---|---|---|---|
| 2025 | $3,719 | $342,471 | $116,000 | $226,471 |
| 2024 | $3,594 | $391,785 | $160,080 | $231,705 |
| 2023 | $3,434 | $396,149 | $160,080 | $236,069 |
| 2022 | $3,461 | $370,681 | $153,120 | $217,561 |
| 2021 | $3,287 | $324,269 | $134,560 | $189,709 |
| 2020 | $3,002 | $289,050 | $121,800 | $167,250 |
| 2019 | $2,773 | $268,170 | $116,000 | $152,170 |
| 2018 | $3,048 | $261,849 | $0 | $0 |
| 2017 | $2,546 | $237,628 | $0 | $0 |
| 2016 | $2,400 | $217,998 | $0 | $0 |
| 2015 | $2,222 | $187,897 | $0 | $0 |
| 2014 | -- | $173,077 | $0 | $0 |
| 2013 | -- | $152,806 | $0 | $0 |
Source: Public Records
Map
Nearby Homes
Your Personal Tour Guide
Ask me questions while you tour the home.