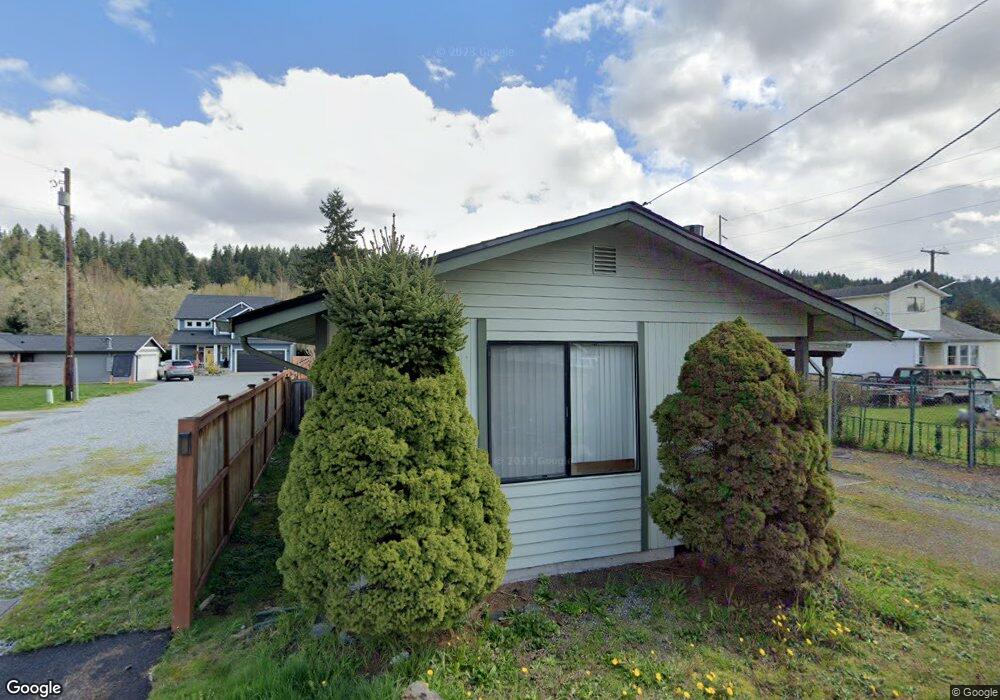
106 Ammons Ln NE Orting, WA 98360
Estimated Value: $341,000 - $394,000
2
Beds
1
Bath
780
Sq Ft
$459/Sq Ft
Est. Value
About This Home
This home is located at 106 Ammons Ln NE, Orting, WA 98360 and is currently estimated at $358,191, approximately $459 per square foot. 106 Ammons Ln NE is a home located in Pierce County with nearby schools including Orting Elementary School, Ptarmigan Ridge Elementary School, and Orting Middle School.
Ownership History
Date
Name
Owned For
Owner Type
Purchase Details
Closed on
Apr 5, 2007
Sold by
Ward Kenneth
Bought by
Ward Ann
Current Estimated Value
Purchase Details
Closed on
Nov 9, 2001
Sold by
Agan Michael J
Bought by
Craig Ann M
Home Financials for this Owner
Home Financials are based on the most recent Mortgage that was taken out on this home.
Original Mortgage
$93,532
Outstanding Balance
$36,287
Interest Rate
6.62%
Mortgage Type
FHA
Estimated Equity
$321,904
Purchase Details
Closed on
Apr 29, 1994
Sold by
Rukke Scott Andrew
Bought by
Agan Michael J
Home Financials for this Owner
Home Financials are based on the most recent Mortgage that was taken out on this home.
Original Mortgage
$75,990
Interest Rate
7.84%
Mortgage Type
Assumption
Create a Home Valuation Report for This Property
The Home Valuation Report is an in-depth analysis detailing your home's value as well as a comparison with similar homes in the area
Home Values in the Area
Average Home Value in this Area
Purchase History
| Date | Buyer | Sale Price | Title Company |
|---|---|---|---|
| Ward Ann | -- | None Available | |
| Craig Ann M | $95,000 | Chicago Title | |
| Agan Michael J | -- | Transamerica Title Ins Co |
Source: Public Records
Mortgage History
| Date | Status | Borrower | Loan Amount |
|---|---|---|---|
| Open | Craig Ann M | $93,532 | |
| Previous Owner | Agan Michael J | $75,990 |
Source: Public Records
Tax History
| Year | Tax Paid | Tax Assessment Tax Assessment Total Assessment is a certain percentage of the fair market value that is determined by local assessors to be the total taxable value of land and additions on the property. | Land | Improvement |
|---|---|---|---|---|
| 2025 | $2,342 | $278,500 | $145,600 | $132,900 |
| 2024 | $2,342 | $265,800 | $137,900 | $127,900 |
| 2023 | $2,342 | $247,600 | $131,800 | $115,800 |
| 2022 | $2,217 | $255,300 | $131,800 | $123,500 |
| 2021 | $2,079 | $171,300 | $83,300 | $88,000 |
| 2019 | $1,828 | $152,700 | $70,700 | $82,000 |
| 2018 | $1,861 | $141,500 | $61,600 | $79,900 |
| 2017 | $1,727 | $123,200 | $49,500 | $73,700 |
| 2016 | $1,584 | $102,600 | $36,700 | $65,900 |
| 2014 | $1,322 | $94,400 | $32,800 | $61,600 |
| 2013 | $1,322 | $78,000 | $25,800 | $52,200 |
Source: Public Records
Map
Nearby Homes
- 316 Bowlin Ave NE
- 121 van Scoyoc Ave SW
- 201 River Ave NE
- 215 Corrin Ave NW Unit C
- 215 Corrin Ave NW Unit B
- 215 Corrin Ave NW Unit D
- 215 Corrin Ave NW Unit A
- 304 Varner Ave SE
- 411 Hardefeldt St SE
- 213 Bridge St SW
- 211 Bridge St SW
- 310 Orting Ave NW
- 103 Harrison Ln SE Unit 1-4
- 317 Icey St SW
- 718 Teetor Cir NW Unit LOT 9
- 722 Teetor Cir NW Unit Lot 11
- 716 Teetor Cir NW Unit Lot 08
- 724 Teetor Cir NW Unit LOT 12
- 726 Teetor Cir NW Unit Lot 13
- 710 Teetor Cir NW
- 209 Calistoga St E
- 207 Calistoga St E
- 112 Ammons Ln NE
- 211 Calistoga St W
- 211 Calistoga St E
- 108 Varner Ave NE
- 110 Varner Ave NE
- 112 Varner Ave NE
- 213 Calistoga St E
- 114 Ammons Ln NE
- 114 Varner Ave NE
- 208 Leber St NE
- 206 Leber St NE
- 120 Varner Ave NE
- 215 Calistoga St E
- 204 Leber St NE
- 300 Leber St NE
- 210 Calistoga St E
- 217 Calistoga St E
- 212 Calistoga St E
Your Personal Tour Guide
Ask me questions while you tour the home.