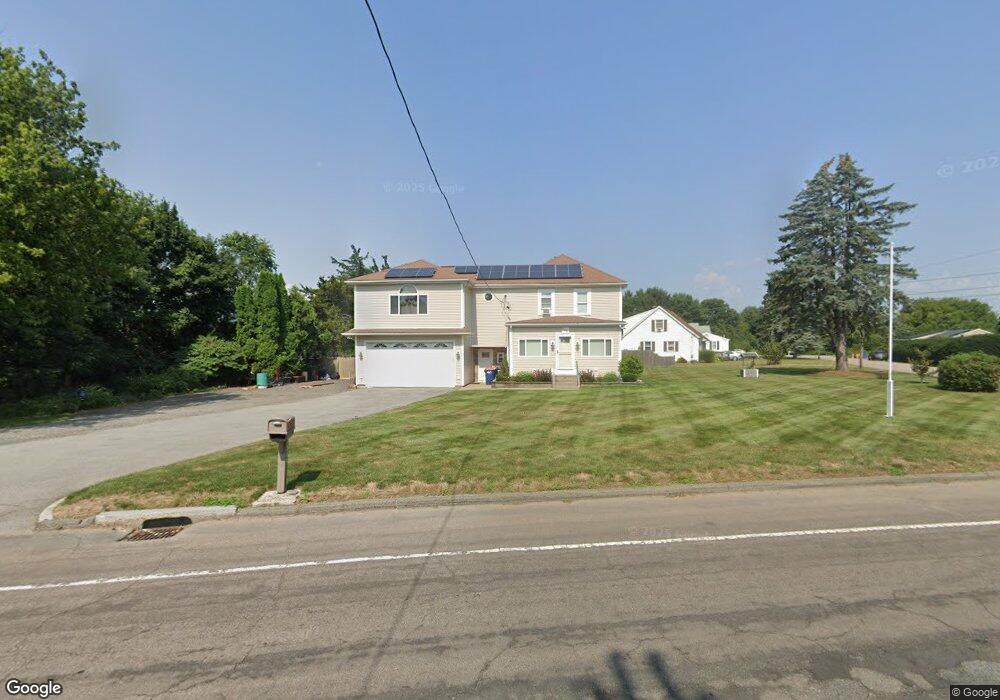
106 Anthony St Seekonk, MA 02771
Monroes-South Seekonk NeighborhoodEstimated Value: $583,000 - $683,000
3
Beds
2
Baths
1,616
Sq Ft
$390/Sq Ft
Est. Value
About This Home
This home is located at 106 Anthony St, Seekonk, MA 02771 and is currently estimated at $629,871, approximately $389 per square foot. 106 Anthony St is a home located in Bristol County with nearby schools including Seekonk High School, St Mary Academy-Bay View, and Providence Country Day School.
Ownership History
Date
Name
Owned For
Owner Type
Purchase Details
Closed on
Jul 30, 2001
Sold by
Blair John H
Bought by
Ledoux Joel A and Ledoux Donna J
Current Estimated Value
Home Financials for this Owner
Home Financials are based on the most recent Mortgage that was taken out on this home.
Original Mortgage
$144,000
Interest Rate
7.18%
Mortgage Type
Purchase Money Mortgage
Create a Home Valuation Report for This Property
The Home Valuation Report is an in-depth analysis detailing your home's value as well as a comparison with similar homes in the area
Home Values in the Area
Average Home Value in this Area
Purchase History
| Date | Buyer | Sale Price | Title Company |
|---|---|---|---|
| Ledoux Joel A | $180,000 | -- |
Source: Public Records
Mortgage History
| Date | Status | Borrower | Loan Amount |
|---|---|---|---|
| Open | Ledoux Joel A | $190,000 | |
| Closed | Ledoux Joel A | $144,000 | |
| Closed | Ledoux Joel A | $27,000 |
Source: Public Records
Tax History
| Year | Tax Paid | Tax Assessment Tax Assessment Total Assessment is a certain percentage of the fair market value that is determined by local assessors to be the total taxable value of land and additions on the property. | Land | Improvement |
|---|---|---|---|---|
| 2025 | $6,417 | $519,600 | $176,500 | $343,100 |
| 2024 | $6,169 | $499,500 | $176,500 | $323,000 |
| 2023 | $5,888 | $449,100 | $150,400 | $298,700 |
| 2022 | $5,320 | $398,800 | $144,300 | $254,500 |
| 2021 | $5,116 | $377,000 | $126,900 | $250,100 |
| 2020 | $4,866 | $369,500 | $127,000 | $242,500 |
| 2019 | $4,598 | $352,100 | $121,100 | $231,000 |
| 2018 | $4,496 | $336,800 | $117,800 | $219,000 |
| 2017 | $4,337 | $322,200 | $114,800 | $207,400 |
| 2016 | $4,275 | $318,800 | $114,800 | $204,000 |
| 2015 | $4,185 | $316,300 | $114,800 | $201,500 |
Source: Public Records
Map
Nearby Homes
- 11 Hawthorne Dr
- 57 Mohawk Dr
- 454 Fall River Ave
- 0 N Wheaton Ave
- 7 Jill Ct
- 30 Fuller St
- 2 Leigh Ln
- 65 Estrell Dr
- 34 Palmer River Rd
- 195 Barney Ave
- 1705 Wampanoag Trail
- 0 Wheaton Ave
- 6 Hazelton Rd
- 106 Wannamoisett Rd
- 203 Providence St Bldr Lot 5
- 205 Providence St Bldr Lot 3
- 296 Fall River Ave
- 15 George w Finnerty Rd
- 25 Winslow St
- 53 Wampanoag Trail
Your Personal Tour Guide
Ask me questions while you tour the home.