Estimated Value: $233,000 - $339,000
3
Beds
2
Baths
1,716
Sq Ft
$157/Sq Ft
Est. Value
About This Home
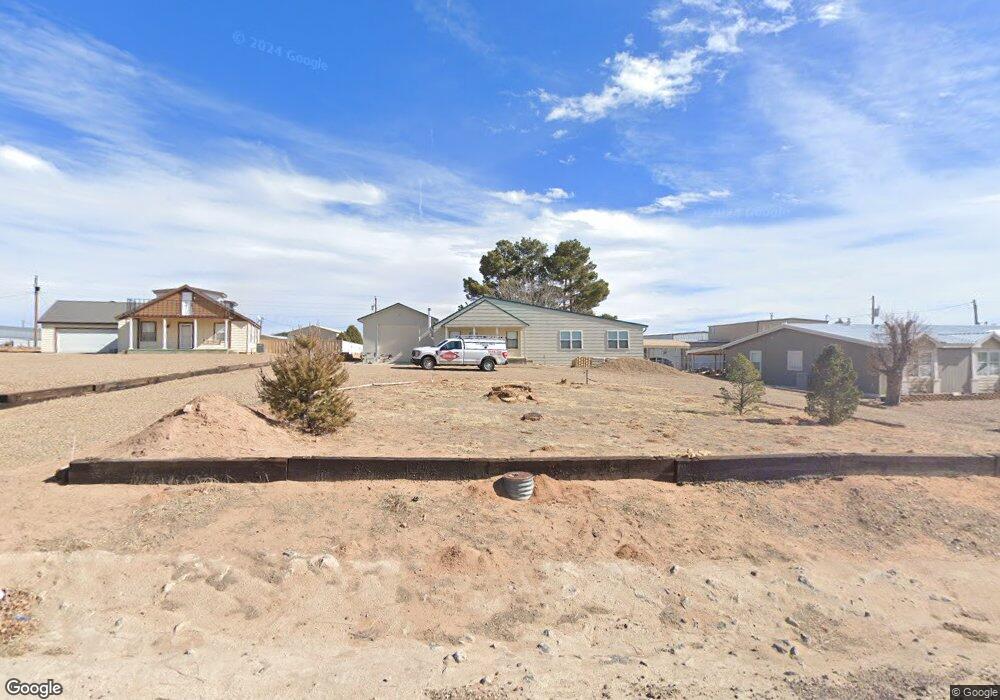
This home is located at 106 Apache Dr, Logan, NM 88426 and is currently estimated at $268,947, approximately $156 per square foot. 106 Apache Dr is a home located in Quay County with nearby schools including Logan Middle School.
Ownership History
Date
Name
Owned For
Owner Type
Purchase Details
Closed on
Mar 31, 2017
Sold by
Howles Angela S
Bought by
Sanchez Ben Alex and Sanchez Kerri Cindy
Current Estimated Value
Home Financials for this Owner
Home Financials are based on the most recent Mortgage that was taken out on this home.
Original Mortgage
$86,250
Outstanding Balance
$71,357
Interest Rate
4%
Mortgage Type
Adjustable Rate Mortgage/ARM
Estimated Equity
$197,590
Purchase Details
Closed on
Feb 28, 2007
Sold by
Morga Charles E and Mora Katherine L
Bought by
Morrow Jerry L
Home Financials for this Owner
Home Financials are based on the most recent Mortgage that was taken out on this home.
Original Mortgage
$145,000
Interest Rate
6.25%
Mortgage Type
VA
Create a Home Valuation Report for This Property
The Home Valuation Report is an in-depth analysis detailing your home's value as well as a comparison with similar homes in the area
Purchase History
| Date | Buyer | Sale Price | Title Company |
|---|---|---|---|
| Sanchez Ben Alex | -- | None Available | |
| Morrow Jerry L | -- | Fts |
Source: Public Records
Mortgage History
| Date | Status | Borrower | Loan Amount |
|---|---|---|---|
| Open | Sanchez Ben Alex | $86,250 | |
| Previous Owner | Morrow Jerry L | $145,000 |
Source: Public Records
Tax History
| Year | Tax Paid | Tax Assessment Tax Assessment Total Assessment is a certain percentage of the fair market value that is determined by local assessors to be the total taxable value of land and additions on the property. | Land | Improvement |
|---|---|---|---|---|
| 2025 | $1,567 | $55,079 | $13,662 | $41,417 |
| 2024 | $16 | $53,475 | $13,264 | $40,211 |
| 2023 | $1,552 | $53,475 | $13,264 | $40,211 |
| 2022 | $1,601 | $53,475 | $13,264 | $40,211 |
| 2021 | $1,466 | $51,907 | $12,875 | $39,032 |
| 2020 | $899 | $31,825 | $12,500 | $19,325 |
| 2019 | $1,675 | $65,028 | $16,667 | $48,361 |
| 2018 | $1,710 | $63,620 | $16,667 | $46,953 |
| 2017 | $1,491 | $63,436 | $21,943 | $41,493 |
| 2016 | $1,491 | $61,588 | $21,304 | $40,284 |
| 2015 | -- | $59,794 | $20,683 | $39,111 |
| 2013 | -- | $174,176 | $60,249 | $113,927 |
Source: Public Records
Map
Nearby Homes
- 102 Apache Dr
- 111 Sioux Rd Unit 13 & 14
- 104 Shawnee Rd
- 200 Pike St
- 504 Walleye Pike Dr
- 107 Kiowa Place
- 307 Sunfish Dr Unit 5-6
- 106 Inca St
- 202 Eel St
- 105 Sunfish Dr
- 119 Laguna Cir
- 108 Laguna Cir
- 4004 New Mexico 540
- 600 Zuni St
- 100 Osage Dr
- 117 Yuma St
- 314 Osage Dr
- 605 Bass St
- 6211 New Mexico 540
- 807 Bass Aly
Your Personal Tour Guide
Ask me questions while you tour the home.