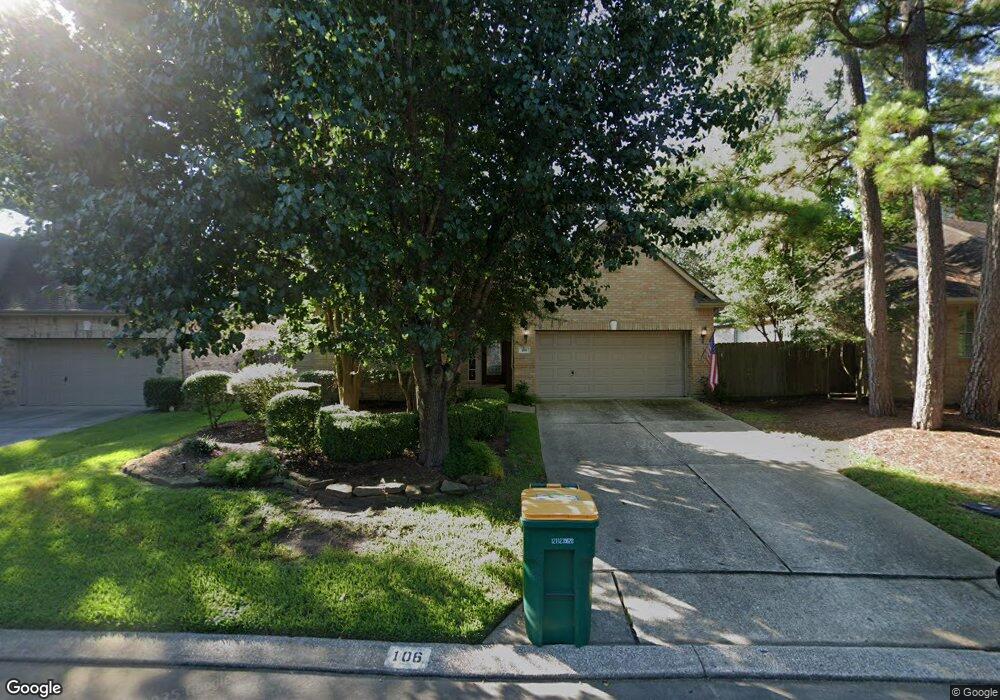
106 Ardsley Square Place Spring, TX 77382
Alden Bridge NeighborhoodEstimated Value: $427,279 - $462,000
2
Beds
2
Baths
2,170
Sq Ft
$203/Sq Ft
Est. Value
About This Home
This home is located at 106 Ardsley Square Place, Spring, TX 77382 and is currently estimated at $440,820, approximately $203 per square foot. 106 Ardsley Square Place is a home located in Montgomery County with nearby schools including Buckalew Elementary School, Mitchell Intermediate School, and McCullough Junior High School.
Ownership History
Date
Name
Owned For
Owner Type
Purchase Details
Closed on
Nov 5, 2010
Sold by
Nelson Ronald G and Nelson Mary
Bought by
Sorrentino Charles L
Current Estimated Value
Purchase Details
Closed on
Mar 31, 2005
Sold by
Schwab Tony C
Bought by
Nelson Ronald G and Nelson Mary
Home Financials for this Owner
Home Financials are based on the most recent Mortgage that was taken out on this home.
Original Mortgage
$149,300
Interest Rate
5.25%
Mortgage Type
Purchase Money Mortgage
Purchase Details
Closed on
May 25, 2001
Sold by
Lennar Homes Of Texas Land & Const Inc
Bought by
Schwab Tony C
Home Financials for this Owner
Home Financials are based on the most recent Mortgage that was taken out on this home.
Original Mortgage
$135,050
Interest Rate
7.1%
Create a Home Valuation Report for This Property
The Home Valuation Report is an in-depth analysis detailing your home's value as well as a comparison with similar homes in the area
Home Values in the Area
Average Home Value in this Area
Purchase History
| Date | Buyer | Sale Price | Title Company |
|---|---|---|---|
| Sorrentino Charles L | -- | -- | |
| Nelson Ronald G | -- | Stewart Title Of Montgomery | |
| Schwab Tony C | -- | Regency Title Company |
Source: Public Records
Mortgage History
| Date | Status | Borrower | Loan Amount |
|---|---|---|---|
| Previous Owner | Nelson Ronald G | $149,300 | |
| Previous Owner | Schwab Tony C | $135,050 | |
| Closed | Schwab Tony C | $25,326 | |
| Closed | Nelson Ronald G | $27,992 |
Source: Public Records
Tax History
| Year | Tax Paid | Tax Assessment Tax Assessment Total Assessment is a certain percentage of the fair market value that is determined by local assessors to be the total taxable value of land and additions on the property. | Land | Improvement |
|---|---|---|---|---|
| 2025 | $1,770 | $404,539 | -- | -- |
| 2024 | $1,689 | $367,763 | -- | -- |
| 2023 | $1,689 | $334,330 | $60,000 | $340,060 |
| 2022 | $6,161 | $303,940 | $60,000 | $308,670 |
| 2021 | $6,027 | $276,310 | $31,590 | $244,720 |
| 2020 | $5,866 | $253,590 | $31,590 | $222,000 |
| 2019 | $7,211 | $302,130 | $31,590 | $275,760 |
| 2018 | $5,237 | $274,660 | $31,590 | $243,070 |
| 2017 | $6,654 | $275,410 | $31,590 | $248,290 |
| 2016 | $6,049 | $250,370 | $31,590 | $235,230 |
| 2015 | $2,913 | $227,610 | $31,590 | $196,020 |
| 2014 | $2,913 | $227,590 | $31,590 | $196,020 |
Source: Public Records
Map
Nearby Homes
- 59 W Bellmeade Place
- 27 S Belfair Place
- 23 W Pipers Green St
- 19 Pipers Meadow St
- 43 N Belfair Place
- 55 W Pipers Green St
- 42 Camber Pine Place
- 230 S Walden Elms Cir
- 6 Orchard Dale Cir
- 27 Auburn Path Dr
- 51 Pipers Meadow St
- 43 Crocus Petal St
- 19 Timberstar St
- 26 N Walden Elms Cir
- 38 Crocus Petal St
- 2 Wintergreen Trail
- 78 N Walden Elms Cir
- 205 Friesian Ln
- 14 Willow Point Place
- 8051 Bay Branch Dr Unit 421
- 102 Ardsley Square Place
- 110 Ardsley Square Place
- 98 Ardsley Square Place
- 22 E Ardsley Square Place
- 18 E Ardsley Square Place
- 103 Ascot Way Ct
- 94 Ardsley Square Place
- 19 Coachman Ridge Place
- 14 E Ardsley Square Place
- 30 Coachman Ridge Place
- 26 Coachman Ridge Place
- 15 Coachman Ridge Place
- 119 Ascot Way Ct
- 99 W Ardsley Square Place
- 107 Ascot Way Ct
- 111 Ascot Way Ct
- 10 E Ardsley Square Place
- 22 Coachman Ridge Place
- 115 Ascot Way Ct
- 11 Coachman Ridge Place
Your Personal Tour Guide
Ask me questions while you tour the home.