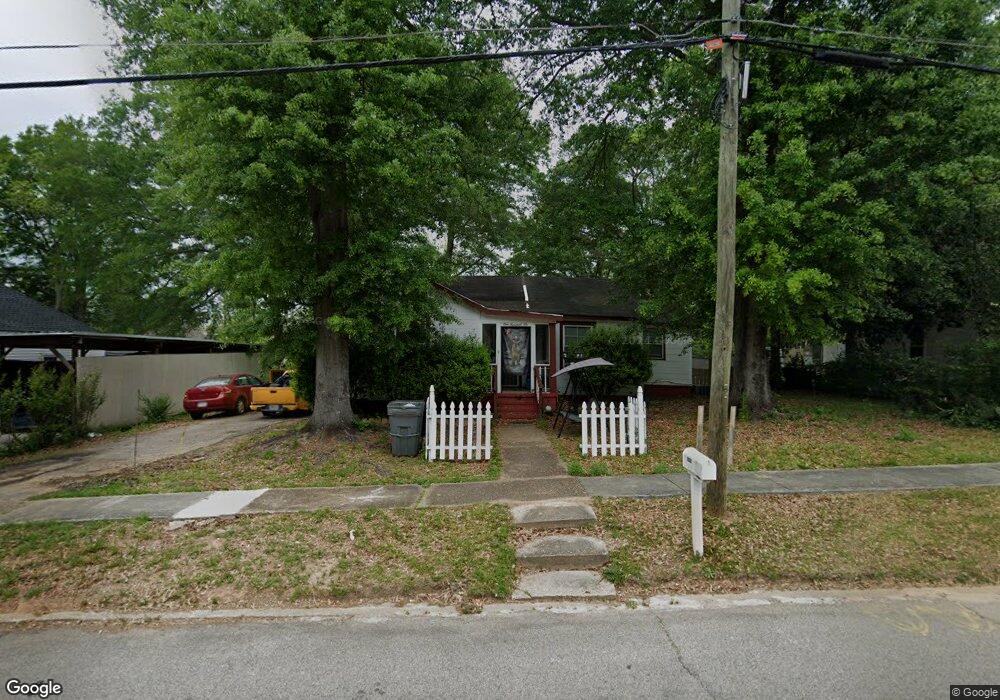
106 Askew Ave Hogansville, GA 30230
Estimated Value: $118,000 - $148,589
2
Beds
1
Bath
1,018
Sq Ft
$131/Sq Ft
Est. Value
About This Home
This home is located at 106 Askew Ave, Hogansville, GA 30230 and is currently estimated at $133,147, approximately $130 per square foot. 106 Askew Ave is a home located in Troup County with nearby schools including Hogansville Elementary School, Callaway Elementary School, and Callaway Middle School.
Ownership History
Date
Name
Owned For
Owner Type
Purchase Details
Closed on
Feb 16, 2007
Sold by
Deutsche Bank National Tru
Bought by
Wilson Emerald
Current Estimated Value
Purchase Details
Closed on
Aug 1, 2006
Sold by
Colton Virginia
Bought by
Bankers Trust Co
Purchase Details
Closed on
Sep 27, 1990
Sold by
Mccain D F
Bought by
Virginia Colton
Purchase Details
Closed on
Mar 19, 1983
Sold by
Gulley
Bought by
Mccain D F
Purchase Details
Closed on
Jul 31, 1981
Sold by
Valerie James and Valerie Hurtt
Bought by
Gulley
Purchase Details
Closed on
Feb 15, 1980
Sold by
John A Irvin
Bought by
Valerie James and Valerie Hurtt
Purchase Details
Closed on
May 29, 1978
Sold by
Maude C Granger
Bought by
John A Irvin
Purchase Details
Closed on
Jan 1, 1973
Sold by
Heirs Of B C Granger
Bought by
Maude C Granger
Purchase Details
Closed on
Oct 28, 1961
Sold by
Matthews Matthews and Matthews Jenkins
Bought by
Heirs Of B C Granger
Create a Home Valuation Report for This Property
The Home Valuation Report is an in-depth analysis detailing your home's value as well as a comparison with similar homes in the area
Home Values in the Area
Average Home Value in this Area
Purchase History
| Date | Buyer | Sale Price | Title Company |
|---|---|---|---|
| Wilson Emerald | $12,000 | -- | |
| Bankers Trust Co | $21,555 | -- | |
| Virginia Colton | $16,000 | -- | |
| Mccain D F | -- | -- | |
| Gulley | $6,000 | -- | |
| Valerie James | $17,200 | -- | |
| John A Irvin | $15,500 | -- | |
| Maude C Granger | -- | -- | |
| Heirs Of B C Granger | -- | -- |
Source: Public Records
Tax History Compared to Growth
Tax History
| Year | Tax Paid | Tax Assessment Tax Assessment Total Assessment is a certain percentage of the fair market value that is determined by local assessors to be the total taxable value of land and additions on the property. | Land | Improvement |
|---|---|---|---|---|
| 2024 | $926 | $26,280 | $8,000 | $18,280 |
| 2023 | $893 | $25,360 | $8,000 | $17,360 |
| 2022 | $696 | $19,400 | $4,000 | $15,400 |
| 2021 | $476 | $12,480 | $2,320 | $10,160 |
| 2020 | $476 | $12,480 | $2,320 | $10,160 |
| 2019 | $459 | $12,040 | $2,320 | $9,720 |
| 2018 | $421 | $11,040 | $2,400 | $8,640 |
| 2017 | $421 | $11,040 | $2,400 | $8,640 |
| 2016 | $327 | $8,582 | $2,400 | $6,182 |
| 2015 | $325 | $8,506 | $2,323 | $6,182 |
| 2014 | $215 | $5,620 | $2,323 | $3,297 |
| 2013 | -- | $6,140 | $2,323 | $3,817 |
Source: Public Records
Map
Nearby Homes
- 100 International St
- 407 Green Ave
- 215 Johnson St
- 213 Johnson St
- 400 Lawrence St
- 606 Green Ave
- 214 Collier St
- 404 Lincoln St
- 203 White Ave
- 205 White St
- 208 Royal Ave
- 402 Power Plant Rd
- 0 Georgia 100 Unit 10591508
- 613 Rifle Ridge
- 617 Rifle Ridge
- 619 Rifle Ridge
- 608 Rifle Ridge
- 614 Rifle Ridge
- 117 Duck Walk Way
- 201 Oak St