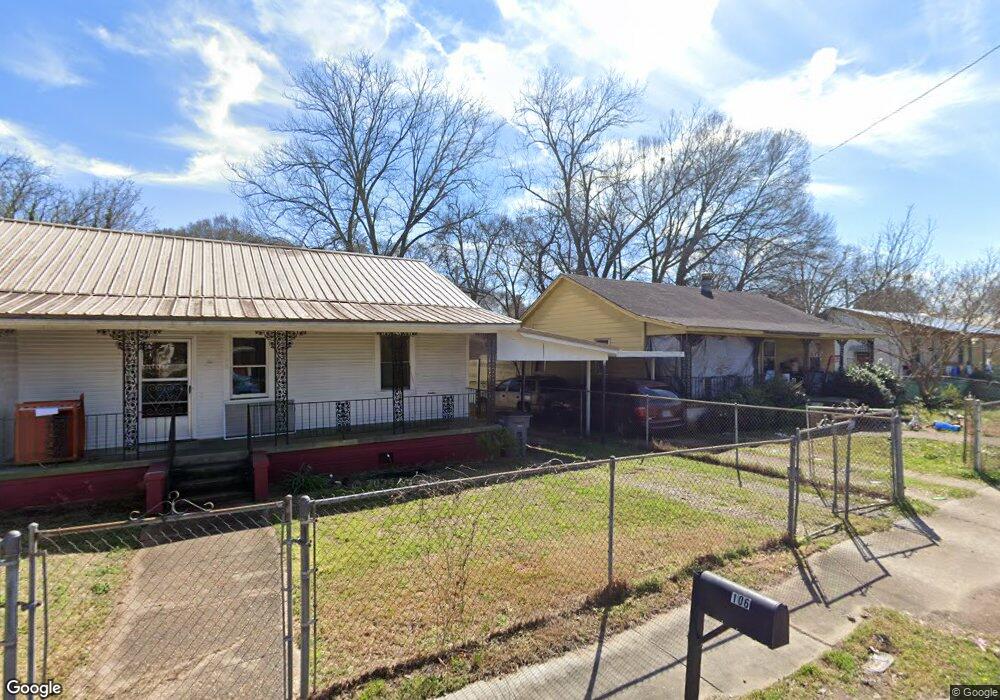
106 Baugh St Lagrange, GA 30241
Estimated Value: $53,000 - $94,000
3
Beds
1
Bath
1,078
Sq Ft
$70/Sq Ft
Est. Value
About This Home
This home is located at 106 Baugh St, Lagrange, GA 30241 and is currently estimated at $75,357, approximately $69 per square foot. 106 Baugh St is a home located in Troup County with nearby schools including Hollis Hand Elementary School, Franklin Forest Elementary School, and Ethel W. Kight Elementary School.
Ownership History
Date
Name
Owned For
Owner Type
Purchase Details
Closed on
Aug 25, 2021
Sold by
M & L Caldwell Realty Llc
Bought by
Martinez Samantha Roblero
Current Estimated Value
Home Financials for this Owner
Home Financials are based on the most recent Mortgage that was taken out on this home.
Original Mortgage
$26,000
Interest Rate
2.8%
Mortgage Type
New Conventional
Purchase Details
Closed on
Jun 27, 2013
Sold by
Goddard Theodore Jonathan
Bought by
M & L Caldwell Realty Llc
Purchase Details
Closed on
May 10, 2013
Sold by
Goddard Emma Lee Orange
Bought by
Goodard John William
Purchase Details
Closed on
Dec 16, 2005
Sold by
Orange Loette
Bought by
Goddard Emma Lee Orange
Purchase Details
Closed on
Mar 4, 1977
Sold by
City Of Lag
Bought by
Loette O Orange
Purchase Details
Closed on
Jan 1, 1952
Sold by
Callaway Fdn
Bought by
City Of Lag
Create a Home Valuation Report for This Property
The Home Valuation Report is an in-depth analysis detailing your home's value as well as a comparison with similar homes in the area
Purchase History
| Date | Buyer | Sale Price | Title Company |
|---|---|---|---|
| Martinez Samantha Roblero | $31,000 | -- | |
| M & L Caldwell Realty Llc | $21,000 | -- | |
| Goodard John William | -- | -- | |
| Goddard Emma Lee Orange | -- | -- | |
| Loette O Orange | -- | -- | |
| City Of Lag | -- | -- |
Source: Public Records
Mortgage History
| Date | Status | Borrower | Loan Amount |
|---|---|---|---|
| Closed | Martinez Samantha Roblero | $26,000 |
Source: Public Records
Tax History
| Year | Tax Paid | Tax Assessment Tax Assessment Total Assessment is a certain percentage of the fair market value that is determined by local assessors to be the total taxable value of land and additions on the property. | Land | Improvement |
|---|---|---|---|---|
| 2025 | $477 | $18,560 | $3,880 | $14,680 |
| 2024 | $477 | $17,480 | $3,880 | $13,600 |
| 2023 | $373 | $13,680 | $3,880 | $9,800 |
| 2022 | $346 | $13,120 | $3,880 | $9,240 |
| 2021 | $361 | $11,960 | $1,280 | $10,680 |
| 2020 | $361 | $11,960 | $1,280 | $10,680 |
| 2019 | $341 | $11,320 | $1,280 | $10,040 |
| 2018 | $341 | $11,320 | $1,280 | $10,040 |
| 2017 | $275 | $9,130 | $1,220 | $7,910 |
| 2016 | $275 | $9,130 | $1,220 | $7,910 |
| 2015 | $234 | $9,130 | $1,305 | $7,825 |
| 2014 | $122 | $4,032 | $566 | $3,466 |
| 2013 | -- | $9,298 | $1,305 | $7,993 |
Source: Public Records
Map
Nearby Homes
Your Personal Tour Guide
Ask me questions while you tour the home.