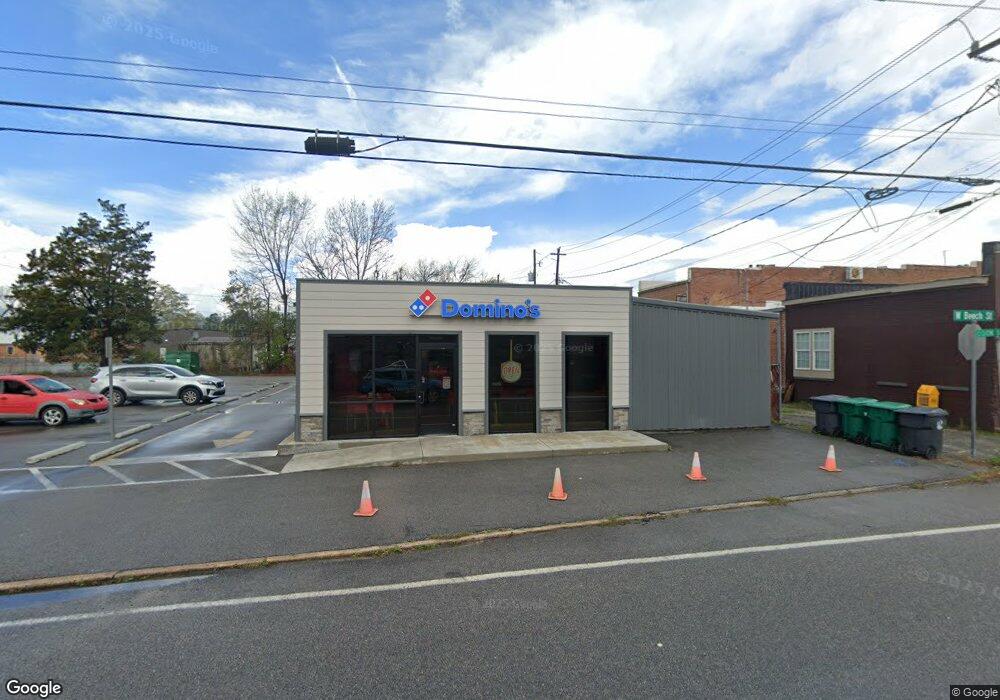
106 Beech St Cochran, GA 31014
Estimated Value: $140,686
Studio
--
Bath
3,000
Sq Ft
$47/Sq Ft
Est. Value
About This Home
This home is located at 106 Beech St, Cochran, GA 31014 and is currently estimated at $140,686, approximately $46 per square foot. 106 Beech St is a home located in Bleckley County with nearby schools including Bleckley County Primary School, Bleckley County Elementary School, and Bleckley Middle School.
Ownership History
Date
Name
Owned For
Owner Type
Purchase Details
Closed on
Mar 11, 2020
Sold by
May Michael Laurence
Bought by
Mmbl Heartland Llc
Current Estimated Value
Purchase Details
Closed on
Jul 31, 2018
Sold by
Wimberly Thomas H
Bought by
May Michael L and Liezert Brian S
Purchase Details
Closed on
Mar 11, 2011
Sold by
Lkh Enterprises Inc
Bought by
Wimberly Thomas H and Wimberly Susan D
Purchase Details
Closed on
Dec 30, 2002
Sold by
Hennessy William J
Bought by
Lkh Enterprises Inc
Purchase Details
Closed on
Sep 25, 2001
Sold by
Bickers William C
Bought by
Hennessy William J
Purchase Details
Closed on
Oct 16, 1998
Sold by
Cannon Ranny L
Bought by
Bickers William C
Purchase Details
Closed on
Jan 10, 1997
Sold by
Cannon Auto Sales
Bought by
Cannon Ranny L
Purchase Details
Closed on
Jul 25, 1991
Bought by
Cannon Auto Sales
Create a Home Valuation Report for This Property
The Home Valuation Report is an in-depth analysis detailing your home's value as well as a comparison with similar homes in the area
Home Values in the Area
Average Home Value in this Area
Purchase History
| Date | Buyer | Sale Price | Title Company |
|---|---|---|---|
| Mmbl Heartland Llc | -- | -- | |
| May Michael L | $78,000 | -- | |
| Wimberly Thomas H | $58,000 | -- | |
| Lkh Enterprises Inc | $75,000 | -- | |
| Hennessy William J | $75,000 | -- | |
| Bickers William C | $63,500 | -- | |
| Cannon Ranny L | $100,800 | -- | |
| Cannon Auto Sales | -- | -- |
Source: Public Records
Tax History
| Year | Tax Paid | Tax Assessment Tax Assessment Total Assessment is a certain percentage of the fair market value that is determined by local assessors to be the total taxable value of land and additions on the property. | Land | Improvement |
|---|---|---|---|---|
| 2025 | $3,170 | $84,840 | $8,640 | $76,200 |
| 2024 | $3,197 | $84,840 | $8,640 | $76,200 |
| 2023 | $1,324 | $32,400 | $8,640 | $23,760 |
| 2022 | $882 | $32,400 | $8,640 | $23,760 |
| 2021 | $920 | $32,400 | $8,640 | $23,760 |
| 2020 | $924 | $32,400 | $8,640 | $23,760 |
| 2019 | $890 | $32,169 | $4,800 | $27,369 |
| 2018 | $1,301 | $32,169 | $4,800 | $27,369 |
| 2017 | $1,141 | $32,169 | $4,800 | $27,369 |
| 2016 | $1,141 | $32,169 | $4,800 | $27,369 |
| 2015 | -- | $32,169 | $4,800 | $27,369 |
| 2014 | -- | $32,169 | $4,800 | $27,369 |
| 2013 | -- | $32,169 | $4,800 | $27,369 |
Source: Public Records
Map
Nearby Homes
- 1277 Georgia 112
- 104 S 4th St
- 161 E Cherry St
- 0 Tiffany Dr Unit 10664262
- 169 W Dykes St
- 119 S 4th St
- 116 W Lewis St
- 132 Mcvay Dr
- 134 Easy St
- 188 E Lewis St
- 113 Taylor Dr
- 112 Pecan St
- 118 Pecan St
- 116 Pecan St
- 229 W Peter St
- 140 Racetrack Dr
- 216 E Peter St
- 151 Edmondson Cir
- 118 Edmondson Cir
- 145 Edmondson Cir
- 108 Beech St
- 109 W Beech St
- 133 N 2nd St Unit A
- 133 N 2nd St
- 133 N Second St Unit SUITE C
- 133 N Second St
- 133 N Second St Unit Suite A
- 105 Beech St
- 135 N 2nd St
- 131 N Second St
- 129 N 2nd St
- 129 N Second St
- 113 W Mendal Ln
- 113 W Mendal Ln
- 130 N Second St
- 130 S 2nd St
- 134 N Second St
- 128 N 2nd St
- 125 N Second St
- 128 N 2nd St
Your Personal Tour Guide
Ask me questions while you tour the home.