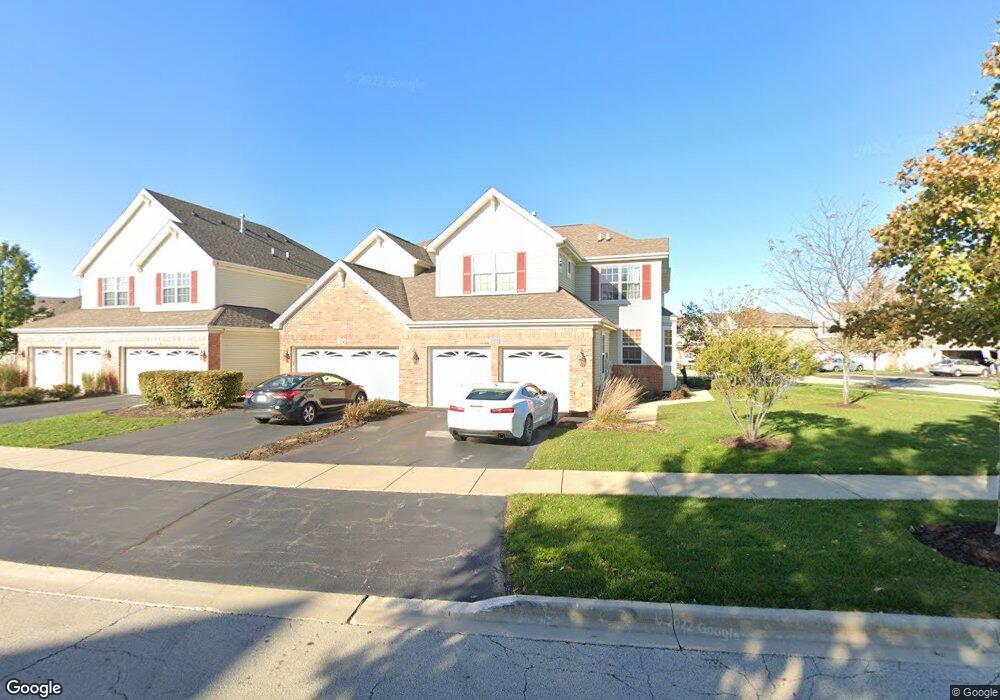
106 Birch Ln Unit 23-3 Saint Charles, IL 60175
Harvest Hills NeighborhoodEstimated Value: $379,032 - $392,000
2
Beds
3
Baths
1,645
Sq Ft
$234/Sq Ft
Est. Value
About This Home
This home is located at 106 Birch Ln Unit 23-3, Saint Charles, IL 60175 and is currently estimated at $385,508, approximately $234 per square foot. 106 Birch Ln Unit 23-3 is a home located in Kane County with nearby schools including Ferson Creek Elementary School, Thompson Middle School, and St Charles East High School.
Ownership History
Date
Name
Owned For
Owner Type
Purchase Details
Closed on
May 31, 2019
Sold by
Courtney Finley Courtney and Courtney Steve
Bought by
Schroeder William and Schroeder Ann E
Current Estimated Value
Home Financials for this Owner
Home Financials are based on the most recent Mortgage that was taken out on this home.
Original Mortgage
$128,000
Outstanding Balance
$99,194
Interest Rate
4.37%
Mortgage Type
New Conventional
Estimated Equity
$286,314
Purchase Details
Closed on
Apr 5, 2013
Sold by
Steve Courtney and Finley Jake
Bought by
Finley Courtney
Home Financials for this Owner
Home Financials are based on the most recent Mortgage that was taken out on this home.
Original Mortgage
$205,779
Interest Rate
3.5%
Mortgage Type
FHA
Purchase Details
Closed on
Jun 6, 2011
Sold by
Remington Glen Llc
Bought by
Steve Courtney
Home Financials for this Owner
Home Financials are based on the most recent Mortgage that was taken out on this home.
Original Mortgage
$208,087
Interest Rate
4.37%
Mortgage Type
FHA
Create a Home Valuation Report for This Property
The Home Valuation Report is an in-depth analysis detailing your home's value as well as a comparison with similar homes in the area
Home Values in the Area
Average Home Value in this Area
Purchase History
| Date | Buyer | Sale Price | Title Company |
|---|---|---|---|
| Schroeder William | $238,000 | Proper Title Llc | |
| Finley Courtney | -- | First American Title | |
| Steve Courtney | $213,500 | Chicago Title Insurance Co |
Source: Public Records
Mortgage History
| Date | Status | Borrower | Loan Amount |
|---|---|---|---|
| Open | Schroeder William | $128,000 | |
| Previous Owner | Finley Courtney | $205,779 | |
| Previous Owner | Steve Courtney | $208,087 |
Source: Public Records
Tax History Compared to Growth
Tax History
| Year | Tax Paid | Tax Assessment Tax Assessment Total Assessment is a certain percentage of the fair market value that is determined by local assessors to be the total taxable value of land and additions on the property. | Land | Improvement |
|---|---|---|---|---|
| 2024 | $7,425 | $108,020 | $24,206 | $83,814 |
| 2023 | $7,097 | $96,680 | $21,665 | $75,015 |
| 2022 | $6,995 | $92,640 | $23,980 | $68,660 |
| 2021 | $6,713 | $88,305 | $22,858 | $65,447 |
| 2020 | $6,638 | $86,659 | $22,432 | $64,227 |
| 2019 | $6,516 | $84,943 | $21,988 | $62,955 |
| 2018 | $6,462 | $83,908 | $21,151 | $62,757 |
| 2017 | $6,288 | $81,039 | $20,428 | $60,611 |
| 2016 | $6,227 | $74,160 | $19,711 | $54,449 |
| 2015 | -- | $70,274 | $19,498 | $50,776 |
| 2014 | -- | $69,877 | $19,498 | $50,379 |
| 2013 | -- | $72,054 | $19,693 | $52,361 |
Source: Public Records
Map
Nearby Homes
- 242 Remington Dr
- 3534 Matisse Dr
- 3350 Saint Michel Ct
- 3042 Saint Michel Ln
- 239 Grand Ridge Rd
- 243 Valley View Dr Unit 2
- 264 Valley View Dr Unit 2
- 423 Horizon Dr W
- 810 Thornwood Dr
- 38W691 W Mary Ln
- 535 Red Sky Dr
- 3006 Langston Cir
- 125 Fairview Dr Unit 7
- 4N220 Thornly Rd
- 39W278 Baert Ln
- 26 S 13th St
- 328 S 14th St Unit 3
- 1010 Walnut St
- 43W321 Creekside Ct
- 2671 Camden St
- 106 Birch Ln
- 106 Birch Ln Unit 3
- 112 Birch Ln
- 112 Birch Ln Unit 23-2
- 100 Birch Ln
- 118 Birch Ln
- 118 Birch Ln Unit 23-1
- 169 Remington Dr
- 163 Remington Dr
- 157 Remington Dr
- 148 Birch Ln
- 117 Remington Dr
- 111 Birch Ln
- 111 Birch Ln Unit 25-2
- 175 Remington Dr
- 117 Birch Ln
- 117 Birch Ln Unit 25-3
- 105 Birch Ln
- 154 Birch Ln
- 123 Birch Ln Unit 25-4