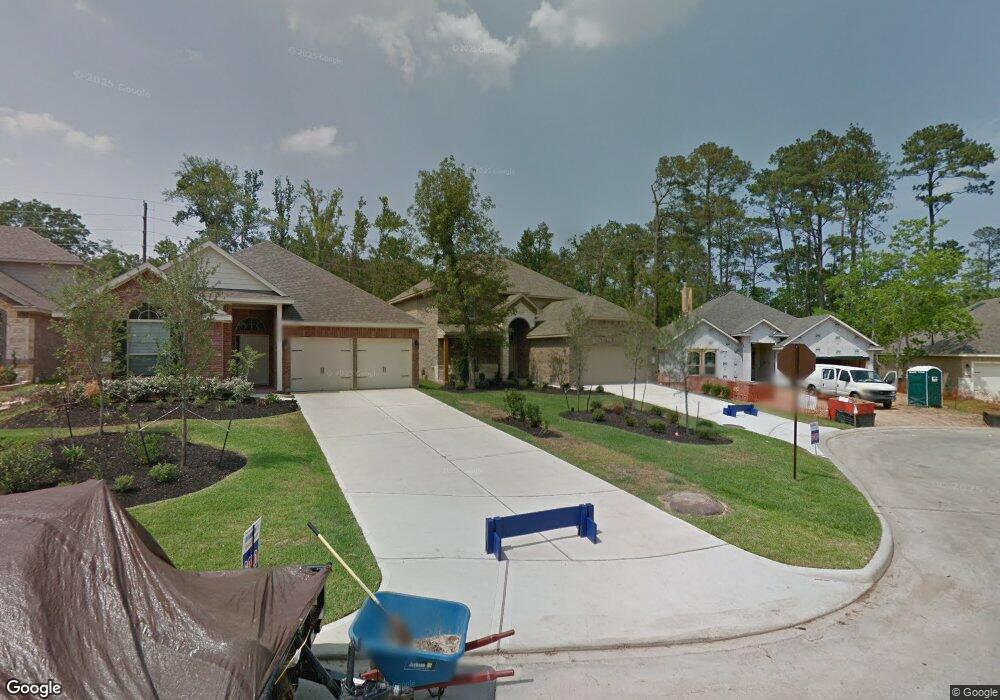
106 Black Swan Place Magnolia, TX 77354
Estimated Value: $438,322 - $472,000
--
Bed
1
Bath
2,534
Sq Ft
$181/Sq Ft
Est. Value
About This Home
This home is located at 106 Black Swan Place, Magnolia, TX 77354 and is currently estimated at $459,081, approximately $181 per square foot. 106 Black Swan Place is a home with nearby schools including Cedric C Smith, Bear Branch Junior High School, and Magnolia High School.
Ownership History
Date
Name
Owned For
Owner Type
Purchase Details
Closed on
Dec 26, 2019
Sold by
Denney Stanley T and Denney Stanley Thomas
Bought by
Denney Sharon E
Current Estimated Value
Home Financials for this Owner
Home Financials are based on the most recent Mortgage that was taken out on this home.
Original Mortgage
$155,600
Outstanding Balance
$137,479
Interest Rate
3.6%
Mortgage Type
New Conventional
Estimated Equity
$321,602
Purchase Details
Closed on
Jun 23, 2011
Sold by
D R Horton Texas Ltd
Bought by
Denney Stanley T and Denney Sharon E
Home Financials for this Owner
Home Financials are based on the most recent Mortgage that was taken out on this home.
Original Mortgage
$200,250
Interest Rate
4.7%
Mortgage Type
Purchase Money Mortgage
Purchase Details
Closed on
Oct 12, 2010
Sold by
Woodlands Land Dev Lp
Bought by
Denney Stanley T and Denney Sharon E
Create a Home Valuation Report for This Property
The Home Valuation Report is an in-depth analysis detailing your home's value as well as a comparison with similar homes in the area
Home Values in the Area
Average Home Value in this Area
Purchase History
| Date | Buyer | Sale Price | Title Company |
|---|---|---|---|
| Denney Sharon E | -- | None Available | |
| Denney Stanley T | -- | Dhi Title | |
| Denney Stanley T | -- | -- |
Source: Public Records
Mortgage History
| Date | Status | Borrower | Loan Amount |
|---|---|---|---|
| Open | Denney Sharon E | $155,600 | |
| Closed | Denney Stanley T | $200,250 |
Source: Public Records
Tax History Compared to Growth
Tax History
| Year | Tax Paid | Tax Assessment Tax Assessment Total Assessment is a certain percentage of the fair market value that is determined by local assessors to be the total taxable value of land and additions on the property. | Land | Improvement |
|---|---|---|---|---|
| 2025 | $6,585 | $417,934 | -- | -- |
| 2024 | $5,917 | $379,940 | -- | -- |
| 2023 | $5,917 | $345,400 | $60,000 | $353,630 |
| 2022 | $7,393 | $314,000 | $60,000 | $322,260 |
| 2021 | $7,059 | $285,450 | $32,570 | $252,880 |
| 2020 | $7,743 | $293,540 | $32,570 | $260,970 |
| 2019 | $7,262 | $268,340 | $32,570 | $235,770 |
| 2018 | $6,629 | $268,340 | $32,570 | $235,770 |
| 2017 | $7,340 | $268,340 | $32,570 | $235,770 |
| 2016 | $7,340 | $268,340 | $32,570 | $235,770 |
| 2015 | $6,566 | $255,970 | $32,570 | $223,400 |
| 2014 | $6,566 | $242,400 | $32,570 | $216,520 |
Source: Public Records
Map
Nearby Homes
- 115 Black Swan Place
- 166 Black Swan Place
- 166 Hawkhurst Cir
- 163 N Hawkhurst Cir
- 30 Black Swan Ct
- 2 Craven Park Ct
- 35 N Star Ridge Cir
- 207 N Vershire Cir
- 10 Barker Ridge Ct
- 158 S Star Ridge Cir
- 146 S Star Ridge Cir
- 10 Heirloom Garden Place
- 119 Benedict Canyon Loop
- 66 Hearthshire Cir
- 51 N Scribewood Cir
- 30 N Scribewood Cir
- 78 S Bardsbrook Cir
- 14 Trailing Lantana Place
- 126 Hearthshire Cir
- 175 N Almondell Way
- 110 Black Swan Place
- 102 Black Swan Place
- 118 Black Swan Place
- 98 Black Swan Place
- 94 Black Swan Place
- 122 Black Swan Place
- 119 Black Swan Place
- 90 Black Swan Place
- 123 Black Swan Place
- 126 Black Swan Place
- 91 Black Swan Place
- 127 Black Swan Place
- 87 Black Swan Place
- 130 Black Swan Place
- 82 Black Swan Place
- 155 Black Swan Place
- 83 Black Swan Place
- 159 Black Swan Place
- 134 Black Swan Place
- 91 Quillwood Place