106 Bluegill Run Eatonton, GA 31024
Estimated Value: $338,000 - $415,000
--
Bed
1
Bath
872
Sq Ft
$413/Sq Ft
Est. Value
About This Home
This home is located at 106 Bluegill Run, Eatonton, GA 31024 and is currently estimated at $360,391, approximately $413 per square foot. 106 Bluegill Run is a home located in Putnam County with nearby schools including Putnam County Primary School, Putnam County Elementary School, and Putnam County Middle School.
Ownership History
Date
Name
Owned For
Owner Type
Purchase Details
Closed on
Dec 20, 2013
Sold by
Cbm Investments Inc
Bought by
Simmons Lisa D
Current Estimated Value
Home Financials for this Owner
Home Financials are based on the most recent Mortgage that was taken out on this home.
Original Mortgage
$129,000
Outstanding Balance
$96,571
Interest Rate
4.25%
Mortgage Type
New Conventional
Estimated Equity
$263,820
Purchase Details
Closed on
Aug 26, 2005
Sold by
Wheeler Steven Wayne
Bought by
Cbm Investments Inc
Home Financials for this Owner
Home Financials are based on the most recent Mortgage that was taken out on this home.
Original Mortgage
$99,900
Interest Rate
5.77%
Mortgage Type
New Conventional
Purchase Details
Closed on
Dec 28, 2001
Sold by
Wheeler E L
Bought by
Wheeler Steven Wayne
Purchase Details
Closed on
Jun 15, 1990
Sold by
Myrick Qenton
Bought by
Wheeler E L
Purchase Details
Closed on
Jan 8, 1987
Sold by
Bowdoin Deborah D
Bought by
Myrick Qenton
Create a Home Valuation Report for This Property
The Home Valuation Report is an in-depth analysis detailing your home's value as well as a comparison with similar homes in the area
Home Values in the Area
Average Home Value in this Area
Purchase History
| Date | Buyer | Sale Price | Title Company |
|---|---|---|---|
| Simmons Lisa D | $129,500 | -- | |
| Cbm Investments Inc | $100,000 | -- | |
| Wheeler Steven Wayne | $60,000 | -- | |
| Wheeler E L | $62,500 | -- | |
| Myrick Qenton | $52,500 | -- |
Source: Public Records
Mortgage History
| Date | Status | Borrower | Loan Amount |
|---|---|---|---|
| Open | Simmons Lisa D | $129,000 | |
| Previous Owner | Cbm Investments Inc | $99,900 |
Source: Public Records
Tax History Compared to Growth
Tax History
| Year | Tax Paid | Tax Assessment Tax Assessment Total Assessment is a certain percentage of the fair market value that is determined by local assessors to be the total taxable value of land and additions on the property. | Land | Improvement |
|---|---|---|---|---|
| 2024 | $2,135 | $123,922 | $66,500 | $57,422 |
| 2023 | $2,135 | $124,268 | $66,500 | $57,768 |
| 2022 | $1,860 | $92,650 | $47,500 | $45,150 |
| 2021 | $1,736 | $76,206 | $47,500 | $28,706 |
| 2020 | $1,684 | $69,485 | $49,248 | $20,237 |
| 2019 | $1,697 | $70,351 | $49,248 | $21,103 |
| 2018 | $1,699 | $68,014 | $49,276 | $18,738 |
| 2017 | $1,587 | $70,379 | $49,276 | $21,103 |
| 2016 | $1,589 | $70,379 | $49,276 | $21,103 |
| 2015 | $1,531 | $70,379 | $49,276 | $21,103 |
| 2014 | $1,128 | $77,400 | $58,662 | $18,738 |
Source: Public Records
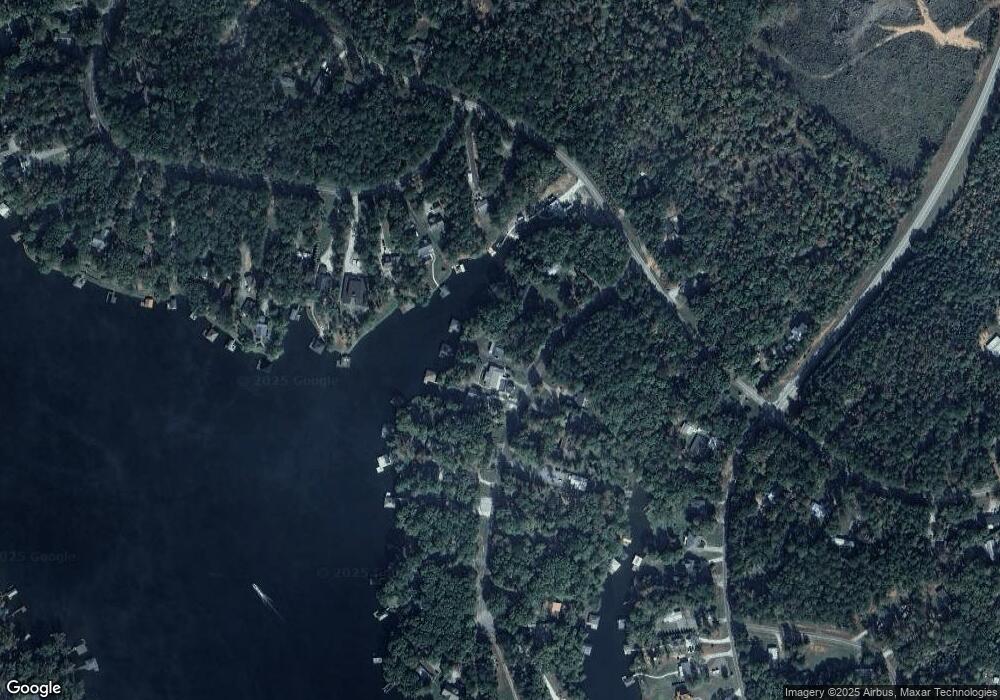
Map
Nearby Homes
- 108 Bluegill Run
- 102 Bluegill Run Unit 123
- 0 Bluegill Run Unit 7493070
- 0 Bluegill Run Unit 8153896
- 0 Bluegill Run Unit 8539531
- 0 Bluegill Run Unit LOT 72 3157923
- 0 Bluegill Run Unit 7628223
- 0 Bluegill Run Unit 8901742
- 0 Bluegill Run Unit 8083274
- 0 Bluegill Run Unit 8763505
- 112 Bluegill Run
- 102 Bluegill Run
- 105 Ahaya Dr
- 109 Bluegill Run
- 103 Sunfish Trail
- 105 Sunfish Trail
- 289 Bluegill Rd
- 114 Bluegill Run
- 101 Sunfish Trail
- 111 Bluegill Run