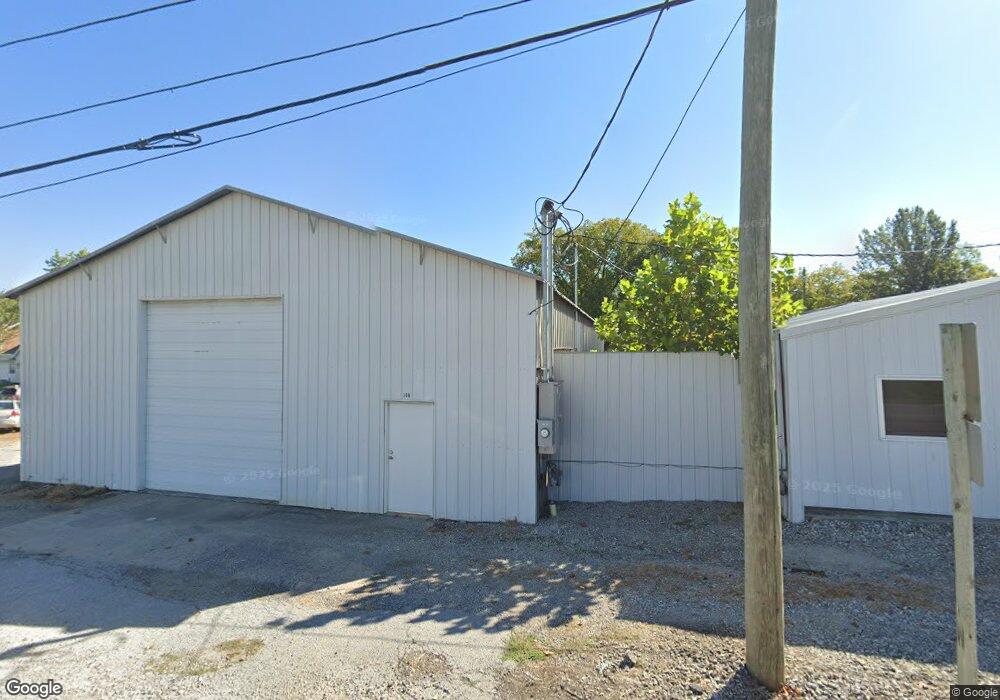
106 Bluff St Fulton, MO 65251
Estimated Value: $201,000 - $329,000
Studio
--
Bath
1,597
Sq Ft
$157/Sq Ft
Est. Value
About This Home
This home is located at 106 Bluff St, Fulton, MO 65251 and is currently estimated at $250,318, approximately $156 per square foot. 106 Bluff St is a home located in Callaway County with nearby schools including Fulton Senior High School, Kingdom Christian Academy, and St. Peter Catholic School.
Ownership History
Date
Name
Owned For
Owner Type
Purchase Details
Closed on
Sep 30, 2021
Sold by
Smith Lt
Bought by
Hagens Dustin and Hagens Kara
Current Estimated Value
Home Financials for this Owner
Home Financials are based on the most recent Mortgage that was taken out on this home.
Original Mortgage
$116,519
Outstanding Balance
$105,328
Interest Rate
2.8%
Mortgage Type
Construction
Estimated Equity
$144,990
Purchase Details
Closed on
Jun 3, 2016
Sold by
Jp Morgan Chase Bank National Associatio
Bought by
River Valley Properties Llc
Purchase Details
Closed on
Jan 26, 2016
Sold by
Snider Anthony D and Scott Barbara J
Bought by
Jpmorgan Chase Bank National Associatio
Create a Home Valuation Report for This Property
The Home Valuation Report is an in-depth analysis detailing your home's value as well as a comparison with similar homes in the area
Home Values in the Area
Average Home Value in this Area
Purchase History
| Date | Buyer | Sale Price | Title Company |
|---|---|---|---|
| Hagens Dustin | -- | None Available | |
| Hagens Dustin | -- | None Listed On Document | |
| Hagens Dustin | -- | None Listed On Document | |
| River Valley Properties Llc | -- | Attorney | |
| Jpmorgan Chase Bank National Associatio | $35,720 | None Available |
Source: Public Records
Mortgage History
| Date | Status | Borrower | Loan Amount |
|---|---|---|---|
| Open | Hagens Dustin | $116,519 | |
| Closed | Hagens Dustin | $116,519 |
Source: Public Records
Tax History
| Year | Tax Paid | Tax Assessment Tax Assessment Total Assessment is a certain percentage of the fair market value that is determined by local assessors to be the total taxable value of land and additions on the property. | Land | Improvement |
|---|---|---|---|---|
| 2025 | $1,995 | $32,291 | $0 | $0 |
| 2024 | $1,995 | $32,291 | $0 | $0 |
| 2023 | $1,997 | $22,160 | $0 | $0 |
| 2022 | $1,364 | $22,160 | $1,520 | $20,640 |
| 2021 | $1,362 | $22,160 | $1,520 | $20,640 |
| 2020 | $1,381 | $22,160 | $1,520 | $20,640 |
| 2019 | $1,336 | $22,160 | $1,520 | $20,640 |
| 2018 | $1,243 | $19,922 | $1,520 | $18,402 |
| 2017 | $355 | $6,409 | $1,520 | $4,889 |
| 2016 | $649 | $10,030 | $0 | $0 |
| 2015 | $568 | $10,030 | $0 | $0 |
| 2014 | $648 | $11,450 | $0 | $0 |
Source: Public Records
Map
Nearby Homes
Your Personal Tour Guide
Ask me questions while you tour the home.