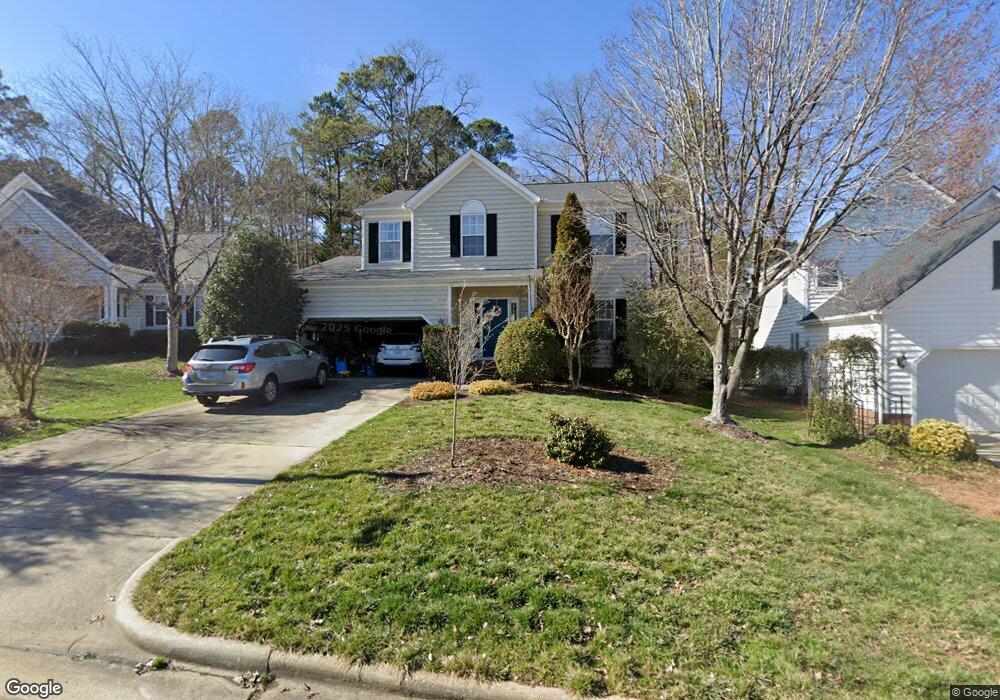
106 Bridlebit Ct Cary, NC 27513
West Cary NeighborhoodEstimated Value: $645,521 - $707,000
4
Beds
3
Baths
1,993
Sq Ft
$344/Sq Ft
Est. Value
About This Home
This home is located at 106 Bridlebit Ct, Cary, NC 27513 and is currently estimated at $685,380, approximately $343 per square foot. 106 Bridlebit Ct is a home located in Wake County with nearby schools including Weatherstone Elementary School, Davis Drive Middle, and Green Hope High.
Ownership History
Date
Name
Owned For
Owner Type
Purchase Details
Closed on
Dec 14, 2015
Sold by
Greeco Kimberly
Bought by
Herring Matthew H and Herring Laura E
Current Estimated Value
Home Financials for this Owner
Home Financials are based on the most recent Mortgage that was taken out on this home.
Original Mortgage
$269,200
Outstanding Balance
$212,606
Interest Rate
3.83%
Mortgage Type
New Conventional
Estimated Equity
$472,774
Purchase Details
Closed on
May 20, 2014
Sold by
Grecco Frank A and Housh Kimberly
Bought by
Grecco Kimberly
Purchase Details
Closed on
Jun 27, 2006
Sold by
Hollowell Wallace C and Hollowell Julie Fraley
Bought by
Grecco Frank A and Housh Kimberly
Home Financials for this Owner
Home Financials are based on the most recent Mortgage that was taken out on this home.
Original Mortgage
$56,400
Interest Rate
6.19%
Mortgage Type
Stand Alone Second
Create a Home Valuation Report for This Property
The Home Valuation Report is an in-depth analysis detailing your home's value as well as a comparison with similar homes in the area
Home Values in the Area
Average Home Value in this Area
Purchase History
| Date | Buyer | Sale Price | Title Company |
|---|---|---|---|
| Herring Matthew H | $336,500 | None Available | |
| Grecco Kimberly | -- | None Available | |
| Grecco Frank A | $282,000 | None Available |
Source: Public Records
Mortgage History
| Date | Status | Borrower | Loan Amount |
|---|---|---|---|
| Open | Herring Matthew H | $269,200 | |
| Previous Owner | Grecco Frank A | $56,400 | |
| Previous Owner | Grecco Frank A | $225,600 |
Source: Public Records
Tax History Compared to Growth
Tax History
| Year | Tax Paid | Tax Assessment Tax Assessment Total Assessment is a certain percentage of the fair market value that is determined by local assessors to be the total taxable value of land and additions on the property. | Land | Improvement |
|---|---|---|---|---|
| 2025 | $5,257 | $611,043 | $240,000 | $371,043 |
| 2024 | $5,053 | $611,043 | $240,000 | $371,043 |
| 2023 | $3,652 | $362,435 | $117,000 | $245,435 |
| 2022 | $3,516 | $362,435 | $117,000 | $245,435 |
| 2021 | $3,445 | $362,435 | $117,000 | $245,435 |
| 2020 | $3,463 | $362,435 | $117,000 | $245,435 |
| 2019 | $3,368 | $312,701 | $102,000 | $210,701 |
| 2018 | $3,161 | $312,701 | $102,000 | $210,701 |
| 2017 | $3,038 | $312,701 | $102,000 | $210,701 |
| 2016 | $2,992 | $312,701 | $102,000 | $210,701 |
| 2015 | $2,862 | $288,652 | $86,000 | $202,652 |
| 2014 | $2,699 | $288,652 | $86,000 | $202,652 |
Source: Public Records
Map
Nearby Homes
- 120 Harmony Hill Ln
- 110 Stablegate Dr
- 117 Hidden Rock Ct
- 101 Breckenwood Dr
- 403 Woodstar Dr
- 316 Arlington Ridge
- 111 N Coslett Ct
- 104 Foxcrest Ct
- 104 Pellinore Ct
- 105 Trailview Dr
- 102 Trailview Dr
- 111 Gingergate Dr
- 206 Swiss Lake Dr
- 205 Swiss Lake Dr
- 124 Covington Square Dr
- 722 Mcrae Rd
- 116 Modena Dr
- 324 Farrow Glen Loop
- 114 Council Gap Ct
- 107 Ethans Glen Ct
- 104 Bridlebit Ct
- 108 Bridlebit Ct
- 102 Bridlebit Ct
- 103 Chaps Ct
- 110 Bridlebit Ct
- 105 Bridlebit Ct
- 105 Chaps Ct
- 103 Bridlebit Ct
- 100 Bridlebit Ct
- 111 Bridlebit Ct
- 107 Bridlebit Ct
- 101 Chaps Ct
- 109 Bridlebit Ct
- 101 Bridlebit Ct
- 104 Chaps Ct
- 302 Stablegate Dr
- 300 Stablegate Dr
- 305 Stablegate Dr
- 123 Harmony Hill Ln
- 102 Chaps Ct