Estimated Value: $291,000 - $325,000
3
Beds
2
Baths
1,760
Sq Ft
$176/Sq Ft
Est. Value
About This Home
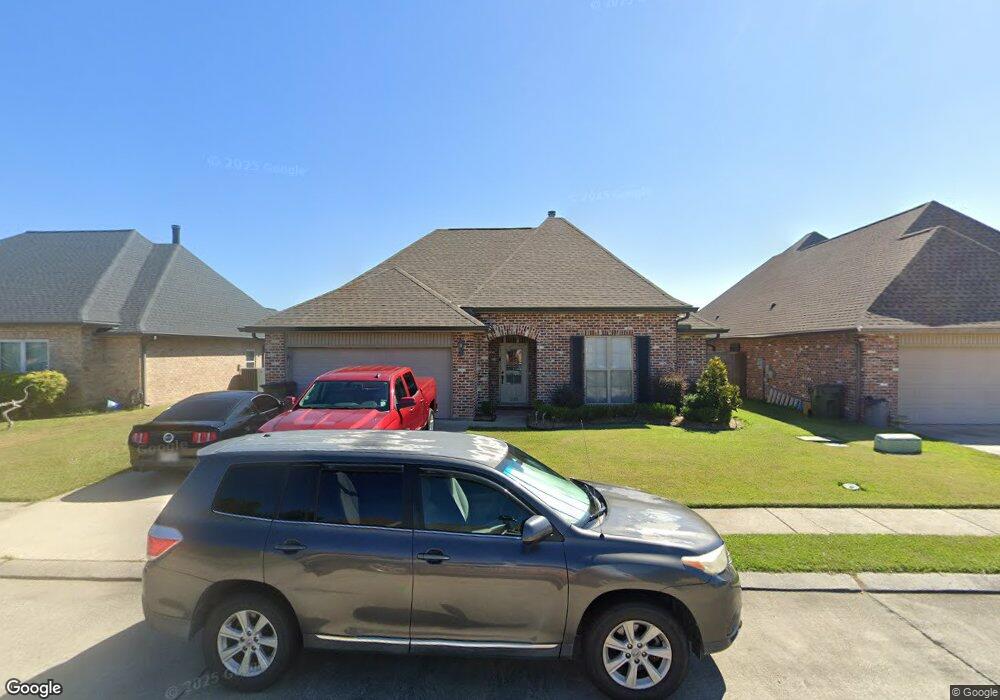
This home is located at 106 Bryce Ln, Houma, LA 70360 and is currently estimated at $310,040, approximately $176 per square foot. 106 Bryce Ln is a home located in Terrebonne Parish with nearby schools including Mulberry Elementary School, Houma Junior High School, and Terrebonne High School.
Ownership History
Date
Name
Owned For
Owner Type
Purchase Details
Closed on
Sep 29, 2022
Sold by
John Cenac Nicholas and John Michelle Courtney
Bought by
Gautreau Robert J and Gautreau Sandra Bonnett
Current Estimated Value
Home Financials for this Owner
Home Financials are based on the most recent Mortgage that was taken out on this home.
Original Mortgage
$185,000
Outstanding Balance
$176,826
Interest Rate
5.13%
Mortgage Type
New Conventional
Estimated Equity
$133,214
Purchase Details
Closed on
Sep 25, 2017
Sold by
Gentry Whitney Elizabeth and Bouterie Whitney Gentry
Bought by
Cenac Nicholas John and Thiodeaux Courtney Michelle
Home Financials for this Owner
Home Financials are based on the most recent Mortgage that was taken out on this home.
Original Mortgage
$239,400
Interest Rate
3.86%
Mortgage Type
New Conventional
Purchase Details
Closed on
May 26, 2010
Sold by
Denton Jerry L and Denton Barbara
Bought by
Gentry Whitney E
Create a Home Valuation Report for This Property
The Home Valuation Report is an in-depth analysis detailing your home's value as well as a comparison with similar homes in the area
Home Values in the Area
Average Home Value in this Area
Purchase History
| Date | Buyer | Sale Price | Title Company |
|---|---|---|---|
| Gautreau Robert J | $325,000 | -- | |
| Gautreau Robert J | $325,000 | None Listed On Document | |
| Cenac Nicholas John | $252,000 | None Available | |
| Gentry Whitney E | $225,000 | -- |
Source: Public Records
Mortgage History
| Date | Status | Borrower | Loan Amount |
|---|---|---|---|
| Open | Gautreau Robert J | $185,000 | |
| Closed | Gautreau Robert J | $185,000 | |
| Previous Owner | Cenac Nicholas John | $239,400 |
Source: Public Records
Tax History Compared to Growth
Tax History
| Year | Tax Paid | Tax Assessment Tax Assessment Total Assessment is a certain percentage of the fair market value that is determined by local assessors to be the total taxable value of land and additions on the property. | Land | Improvement |
|---|---|---|---|---|
| 2024 | $1,938 | $28,290 | $3,290 | $25,000 |
| 2023 | $1,968 | $17,740 | $3,290 | $14,450 |
| 2022 | $1,019 | $17,740 | $3,290 | $14,450 |
| 2021 | $879 | $16,300 | $3,290 | $13,010 |
| 2020 | $1,468 | $17,740 | $3,290 | $14,450 |
| 2019 | $1,555 | $17,310 | $2,860 | $14,450 |
| 2018 | $931 | $16,480 | $2,720 | $13,760 |
| 2017 | $1,476 | $16,480 | $2,720 | $13,760 |
| 2015 | $590 | $15,690 | $2,590 | $13,100 |
| 2014 | $869 | $15,690 | $0 | $0 |
| 2013 | $870 | $15,690 | $0 | $0 |
Source: Public Records
Map
Nearby Homes
- 115 Bryce Ln
- 110 Rusty Ln
- 432 Southdown Blvd W
- 378 Shoal Dr
- 1507 Coral Dr
- 332 N Moss Dr
- 115 Wimberly Way
- 302 N Moss Dr
- 1402 Levee Dr
- 208 Angelle Dr
- 232 Mandalay West Dr
- 240 Mandalay Dr W
- 206 Angelle Dr
- 213 Westport Dr
- 209 Denning Dr
- 324 Inglewood Way
- 114 Angelle Cir
- 307 Wayside Dr
- 301 Pendleton Dr
- 262 Inglewood Way