Estimated Value: $180,113 - $235,000
3
Beds
1
Bath
1,309
Sq Ft
$166/Sq Ft
Est. Value
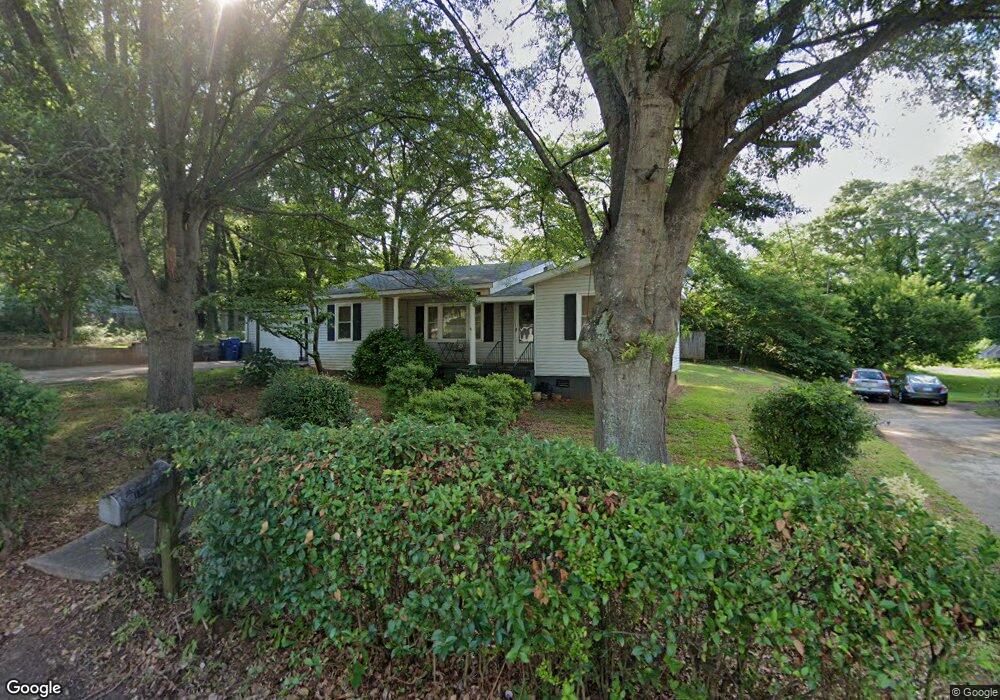
About This Home
This home is located at 106 Burns St, Lyman, SC 29365 and is currently estimated at $216,778, approximately $165 per square foot. 106 Burns St is a home located in Spartanburg County with nearby schools including Wellford Academy Of Science And Techology, Byrnes Freshman Academy, and D.R. Hill Middle School.
Ownership History
Date
Name
Owned For
Owner Type
Purchase Details
Closed on
Jan 11, 2008
Sold by
J W Management Llc
Bought by
Rhoads Iris
Current Estimated Value
Home Financials for this Owner
Home Financials are based on the most recent Mortgage that was taken out on this home.
Original Mortgage
$102,000
Outstanding Balance
$64,048
Interest Rate
6.06%
Mortgage Type
Purchase Money Mortgage
Estimated Equity
$152,730
Purchase Details
Closed on
May 15, 2007
Sold by
Lasalle Bank Na
Bought by
Jw Management Llc
Home Financials for this Owner
Home Financials are based on the most recent Mortgage that was taken out on this home.
Original Mortgage
$25,250
Interest Rate
6.16%
Mortgage Type
Purchase Money Mortgage
Purchase Details
Closed on
Jan 19, 2007
Sold by
Hill Betty and Hill Betty J
Bought by
Lasalle Bank Na and Holders Of Merrill Lynch Mortgage Invest
Create a Home Valuation Report for This Property
The Home Valuation Report is an in-depth analysis detailing your home's value as well as a comparison with similar homes in the area
Home Values in the Area
Average Home Value in this Area
Purchase History
| Date | Buyer | Sale Price | Title Company |
|---|---|---|---|
| Rhoads Iris | $100,000 | Attorney | |
| Jw Management Llc | $26,000 | None Available | |
| Lasalle Bank Na | $2,500 | None Available |
Source: Public Records
Mortgage History
| Date | Status | Borrower | Loan Amount |
|---|---|---|---|
| Open | Rhoads Iris | $102,000 | |
| Previous Owner | Jw Management Llc | $25,250 |
Source: Public Records
Tax History
| Year | Tax Paid | Tax Assessment Tax Assessment Total Assessment is a certain percentage of the fair market value that is determined by local assessors to be the total taxable value of land and additions on the property. | Land | Improvement |
|---|---|---|---|---|
| 2025 | $374 | $2,930 | $1,042 | $1,888 |
| 2024 | $374 | $2,930 | $1,042 | $1,888 |
| 2023 | $374 | $2,930 | $1,042 | $1,888 |
| 2022 | $259 | $2,548 | $781 | $1,767 |
| 2021 | $259 | $2,548 | $781 | $1,767 |
| 2020 | $250 | $2,548 | $781 | $1,767 |
| 2019 | $250 | $2,548 | $781 | $1,767 |
| 2018 | $229 | $2,548 | $781 | $1,767 |
| 2017 | $162 | $2,216 | $600 | $1,616 |
| 2016 | $161 | $2,216 | $600 | $1,616 |
| 2015 | $156 | $2,216 | $600 | $1,616 |
| 2014 | $151 | $2,216 | $600 | $1,616 |
Source: Public Records
Map
Nearby Homes
- 113 Burns St
- 107 Cottage St
- 1129 Old Spartanburg Hwy
- 181 Dodd St
- 193 Dodd St
- 151 Lynn Dr
- 61 Carver St
- 136 Moore St
- 148 Peterson Dr
- 179 Cedar Ave
- 177 Cedar Ave
- 216 Wayfair Ln
- 110 Pacific Mill Place
- 106 Pacific Mill Place
- 104 Pacific Mill Place
- 108 Pacific Mill Place
- 120 Pacific Mill Place
- 118 Pacific Mill Place
- 116 Pacific Mill Place
- 114 Pacific Mill Place
- 104 Burns St
- 113 S 1659
- 109 Burns St
- 111 Burns St
- 115 S 1659
- 115 Burns St
- 105 Burns St
- 115 Cottage St
- 205 Cottage St
- 117 Burns St
- 107 107 Cottage St St
- 105 Cottage St
- 1074 Old Spartanburg Hwy
- 203 Cottage St
- 103 Cottage St
- 201 Cottage St
- 608 Greenville Hwy
- 107 Ash Ave
- 1026 Old Spartanburg Hwy
- 105 Ash Ave
Your Personal Tour Guide
Ask me questions while you tour the home.