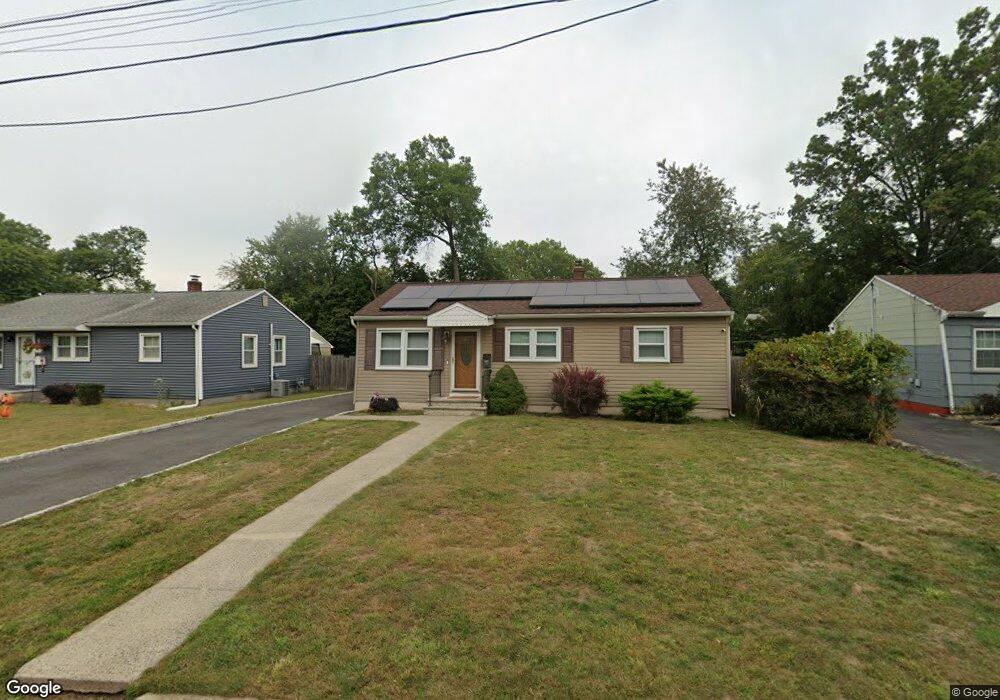
106 Cap Ln Middlesex, NJ 08846
Estimated Value: $340,000 - $465,000
3
Beds
1
Bath
--
Sq Ft
10,280
Sq Ft
About This Home
This home is located at 106 Cap Ln, Middlesex, NJ 08846 and is currently estimated at $430,163. 106 Cap Ln is a home located in Middlesex County with nearby schools including Middlesex High School and Our Lady of Mount Virgin School.
Ownership History
Date
Name
Owned For
Owner Type
Purchase Details
Closed on
Jul 9, 2003
Sold by
Pillai Mohankumar
Bought by
Emery Michael and Emery Brenda
Current Estimated Value
Home Financials for this Owner
Home Financials are based on the most recent Mortgage that was taken out on this home.
Original Mortgage
$146,400
Interest Rate
6.02%
Purchase Details
Closed on
Mar 31, 2000
Sold by
Thomas Donald
Bought by
Pillai Mohankumar and Pillai Chitra
Home Financials for this Owner
Home Financials are based on the most recent Mortgage that was taken out on this home.
Original Mortgage
$109,300
Interest Rate
8.21%
Create a Home Valuation Report for This Property
The Home Valuation Report is an in-depth analysis detailing your home's value as well as a comparison with similar homes in the area
Home Values in the Area
Average Home Value in this Area
Purchase History
| Date | Buyer | Sale Price | Title Company |
|---|---|---|---|
| Emery Michael | $183,000 | -- | |
| Pillai Mohankumar | $121,500 | -- |
Source: Public Records
Mortgage History
| Date | Status | Borrower | Loan Amount |
|---|---|---|---|
| Previous Owner | Emery Michael | $146,400 | |
| Previous Owner | Pillai Mohankumar | $109,300 |
Source: Public Records
Tax History
| Year | Tax Paid | Tax Assessment Tax Assessment Total Assessment is a certain percentage of the fair market value that is determined by local assessors to be the total taxable value of land and additions on the property. | Land | Improvement |
|---|---|---|---|---|
| 2025 | $8,291 | $429,200 | $135,500 | $293,700 |
| 2024 | $7,893 | $358,300 | $135,500 | $222,800 |
Source: Public Records
Map
Nearby Homes
Your Personal Tour Guide
Ask me questions while you tour the home.