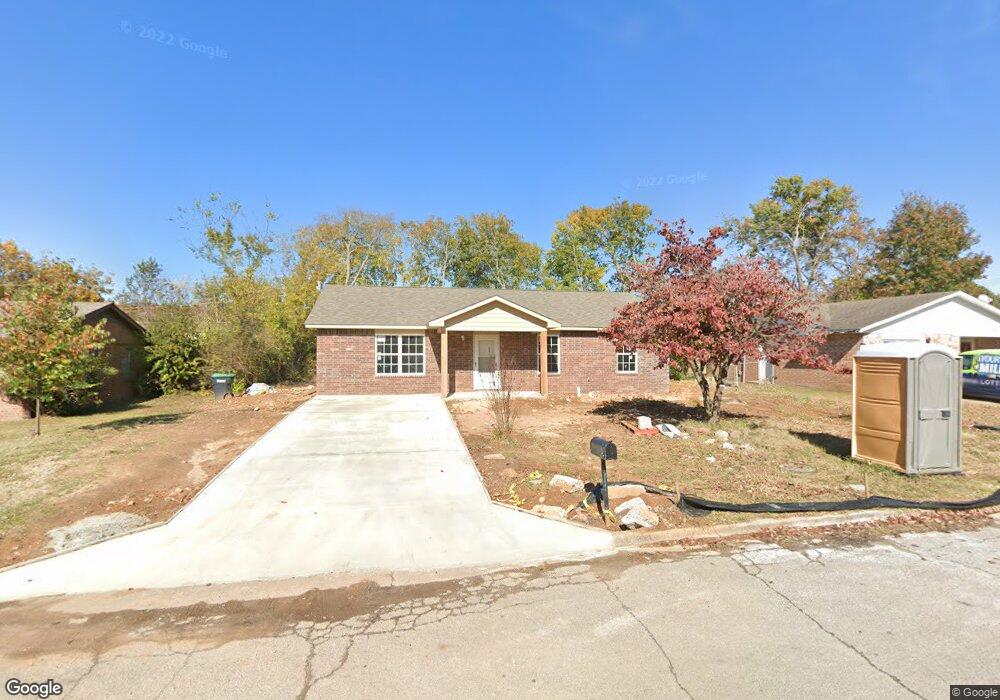
106 Carol St Tahlequah, OK 74464
Estimated Value: $158,000 - $200,000
2
Beds
3
Baths
1,440
Sq Ft
$124/Sq Ft
Est. Value
About This Home
This home is located at 106 Carol St, Tahlequah, OK 74464 and is currently estimated at $179,266, approximately $124 per square foot. 106 Carol St is a home located in Cherokee County with nearby schools including Grand View Public School, Agape Christian Academy, and Shiloh Christian School.
Ownership History
Date
Name
Owned For
Owner Type
Purchase Details
Closed on
Mar 25, 2022
Sold by
Betty Sly
Bought by
Indian Housing Block Grant
Current Estimated Value
Purchase Details
Closed on
Jun 21, 2018
Sold by
Sly Gloria E
Bought by
Sly Betty and Sly Danielle
Home Financials for this Owner
Home Financials are based on the most recent Mortgage that was taken out on this home.
Original Mortgage
$33,529
Interest Rate
4.5%
Mortgage Type
Future Advance Clause Open End Mortgage
Purchase Details
Closed on
Mar 16, 2018
Sold by
Angela Jones
Bought by
Jones Robert S
Purchase Details
Closed on
Apr 3, 2015
Sold by
Sly Johnny Richard and Sly Betty
Bought by
Sly Betty and Sly Danielle
Purchase Details
Closed on
Aug 3, 2009
Sold by
Sly John Richard and Sly Betty
Bought by
Sly Johnny Richard and Sly Betty
Create a Home Valuation Report for This Property
The Home Valuation Report is an in-depth analysis detailing your home's value as well as a comparison with similar homes in the area
Home Values in the Area
Average Home Value in this Area
Purchase History
| Date | Buyer | Sale Price | Title Company |
|---|---|---|---|
| Indian Housing Block Grant | -- | None Listed On Document | |
| Sly Betty | -- | Gcat | |
| Jones Robert S | -- | None Listed On Document | |
| Sly Betty | -- | None Available | |
| Sly Johnny Richard | -- | None Available |
Source: Public Records
Mortgage History
| Date | Status | Borrower | Loan Amount |
|---|---|---|---|
| Previous Owner | Sly Betty | $33,529 |
Source: Public Records
Tax History Compared to Growth
Tax History
| Year | Tax Paid | Tax Assessment Tax Assessment Total Assessment is a certain percentage of the fair market value that is determined by local assessors to be the total taxable value of land and additions on the property. | Land | Improvement |
|---|---|---|---|---|
| 2025 | $396 | $5,940 | $990 | $4,950 |
| 2024 | $396 | $5,767 | $990 | $4,777 |
| 2023 | $396 | $5,599 | $990 | $4,609 |
| 2022 | $315 | $5,436 | $990 | $4,446 |
| 2021 | $304 | $5,278 | $990 | $4,288 |
| 2020 | $293 | $5,125 | $990 | $4,135 |
| 2019 | $308 | $4,976 | $990 | $3,986 |
| 2018 | $299 | $4,830 | $990 | $3,840 |
| 2017 | $290 | $4,689 | $990 | $3,699 |
| 2016 | $281 | $4,553 | $990 | $3,563 |
| 2015 | $268 | $4,420 | $990 | $3,430 |
| 2014 | $259 | $4,292 | $467 | $3,825 |
Source: Public Records
Map
Nearby Homes