Estimated Value: $323,000 - $413,000
3
Beds
2
Baths
1,845
Sq Ft
$199/Sq Ft
Est. Value
About This Home
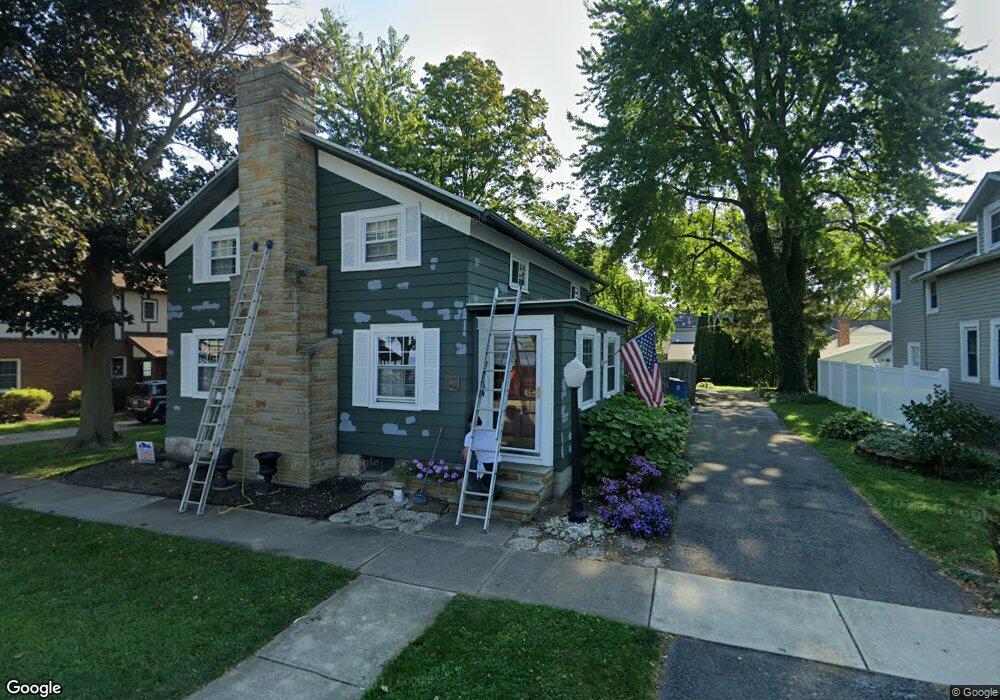
This home is located at 106 Center St, Huron, OH 44839 and is currently estimated at $367,219, approximately $199 per square foot. 106 Center St is a home located in Erie County with nearby schools including Shawnee Elementary School, Woodlands Intermediate School, and McCormick Junior High School.
Ownership History
Date
Name
Owned For
Owner Type
Purchase Details
Closed on
Jun 28, 2023
Sold by
Kottlowski Sally E and Kottlowski Brian
Bought by
Chamberlin Matthew and Chamberlin Carole
Current Estimated Value
Home Financials for this Owner
Home Financials are based on the most recent Mortgage that was taken out on this home.
Original Mortgage
$304,000
Outstanding Balance
$293,901
Interest Rate
6.39%
Mortgage Type
New Conventional
Estimated Equity
$73,318
Purchase Details
Closed on
May 19, 2023
Sold by
Kottlowski Sally E
Bought by
Kottlowski Sally E
Home Financials for this Owner
Home Financials are based on the most recent Mortgage that was taken out on this home.
Original Mortgage
$304,000
Outstanding Balance
$293,901
Interest Rate
6.39%
Mortgage Type
New Conventional
Estimated Equity
$73,318
Purchase Details
Closed on
Jan 1, 1987
Bought by
Taylor June C
Create a Home Valuation Report for This Property
The Home Valuation Report is an in-depth analysis detailing your home's value as well as a comparison with similar homes in the area
Home Values in the Area
Average Home Value in this Area
Purchase History
We collect this data history from publicly available records. To have your information removed, we recommend requesting removal directly through your county’s website.
| Date | Buyer | Sale Price | Title Company |
|---|---|---|---|
| Chamberlin Matthew | $320,000 | None Listed On Document | |
| Kottlowski Sally E | -- | None Listed On Document | |
| Taylor June C | -- | -- |
Source: Public Records
Mortgage History
We collect this data history from publicly available records. To have your information removed, we recommend requesting removal directly through your county’s website.
| Date | Status | Borrower | Loan Amount |
|---|---|---|---|
| Open | Chamberlin Matthew | $304,000 |
Source: Public Records
Tax History
| Year | Tax Paid | Tax Assessment Tax Assessment Total Assessment is a certain percentage of the fair market value that is determined by local assessors to be the total taxable value of land and additions on the property. | Land | Improvement |
|---|---|---|---|---|
| 2025 | $2,231 | $53,339 | $9,201 | $44,138 |
| 2024 | $2,231 | $53,339 | $9,201 | $44,138 |
| 2023 | $2,276 | $47,008 | $8,088 | $38,920 |
| 2022 | $1,614 | $47,526 | $8,610 | $38,916 |
| 2021 | $1,610 | $47,530 | $8,610 | $38,920 |
| 2020 | $1,438 | $42,490 | $8,610 | $33,880 |
| 2019 | $1,504 | $42,490 | $8,610 | $33,880 |
| 2018 | $1,512 | $42,490 | $8,610 | $33,880 |
| 2017 | $1,509 | $41,490 | $10,550 | $30,940 |
| 2016 | $1,452 | $41,490 | $10,550 | $30,940 |
| 2015 | $1,457 | $41,490 | $10,550 | $30,940 |
| 2014 | $1,420 | $40,300 | $10,550 | $29,750 |
| 2013 | $327 | $40,300 | $10,550 | $29,750 |
Source: Public Records
Map
Nearby Homes
- 28 Turtle Bay
- 346 Main St
- 323 Portland Dr
- 11 Turtle Bay
- 706 Creekside Dr
- 124 Tiffin Ave
- 124 Tiffin Ave Unit A/B
- 301 Willow Dr
- 676 Salem Dr
- 613 Oneida View Place
- 724 Strowbridge Dr
- 4075 Coventry Cir
- 1 Cleveland Rd W
- 328 Windsor Ct
- 1140 Sheltered Brook Dr
- 1311 Cleveland Rd W Unit 3
- 1311 Cleveland Rd W
- 1114 Mudbrook Rd
- 710 River Rd
- 1361 Cleveland Rd W Unit C
Your Personal Tour Guide
Ask me questions while you tour the home.