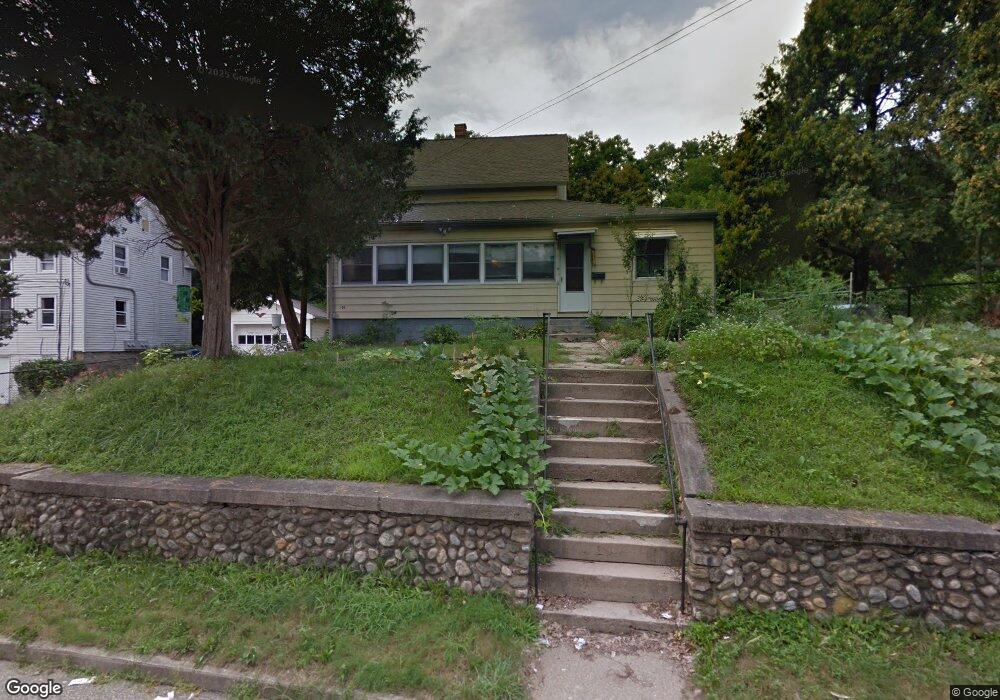
106 Chapman St Willimantic, CT 06226
Estimated Value: $222,000 - $261,000
5
Beds
2
Baths
1,344
Sq Ft
$181/Sq Ft
Est. Value
About This Home
This home is located at 106 Chapman St, Willimantic, CT 06226 and is currently estimated at $243,193, approximately $180 per square foot. 106 Chapman St is a home located in Windham County with nearby schools including Windham Middle School, Windham High School, and St Mary St Joseph School.
Ownership History
Date
Name
Owned For
Owner Type
Purchase Details
Closed on
Oct 30, 2008
Sold by
Deutsche Bank Natl T C
Bought by
Walker John D
Current Estimated Value
Home Financials for this Owner
Home Financials are based on the most recent Mortgage that was taken out on this home.
Original Mortgage
$41,175
Interest Rate
5.38%
Mortgage Type
Purchase Money Mortgage
Purchase Details
Closed on
Jul 28, 1997
Sold by
Rijs Helen
Bought by
Fernandez Angel and Fernandez Awilda
Home Financials for this Owner
Home Financials are based on the most recent Mortgage that was taken out on this home.
Original Mortgage
$60,100
Interest Rate
6%
Mortgage Type
Purchase Money Mortgage
Create a Home Valuation Report for This Property
The Home Valuation Report is an in-depth analysis detailing your home's value as well as a comparison with similar homes in the area
Home Values in the Area
Average Home Value in this Area
Purchase History
| Date | Buyer | Sale Price | Title Company |
|---|---|---|---|
| Walker John D | $54,900 | -- | |
| Fernandez Angel | $62,000 | -- |
Source: Public Records
Mortgage History
| Date | Status | Borrower | Loan Amount |
|---|---|---|---|
| Closed | Fernandez Angel | $41,175 | |
| Previous Owner | Fernandez Angel | $157,500 | |
| Previous Owner | Fernandez Angel | $83,850 | |
| Previous Owner | Fernandez Angel | $60,100 | |
| Closed | Fernandez Angel | $7,200 |
Source: Public Records
Tax History
| Year | Tax Paid | Tax Assessment Tax Assessment Total Assessment is a certain percentage of the fair market value that is determined by local assessors to be the total taxable value of land and additions on the property. | Land | Improvement |
|---|---|---|---|---|
| 2025 | $3,912 | $105,660 | $18,960 | $86,700 |
| 2024 | $3,916 | $105,660 | $18,960 | $86,700 |
| 2023 | $3,154 | $66,530 | $16,490 | $50,040 |
| 2022 | $3,107 | $66,530 | $16,490 | $50,040 |
| 2021 | $3,332 | $66,530 | $16,490 | $50,040 |
| 2020 | $3,325 | $66,530 | $16,490 | $50,040 |
| 2019 | $3,271 | $66,530 | $16,490 | $50,040 |
| 2017 | $3,474 | $72,960 | $19,010 | $53,950 |
| 2015 | $3,355 | $72,960 | $19,010 | $53,950 |
| 2014 | $3,169 | $72,960 | $19,010 | $53,950 |
Source: Public Records
Map
Nearby Homes
Your Personal Tour Guide
Ask me questions while you tour the home.