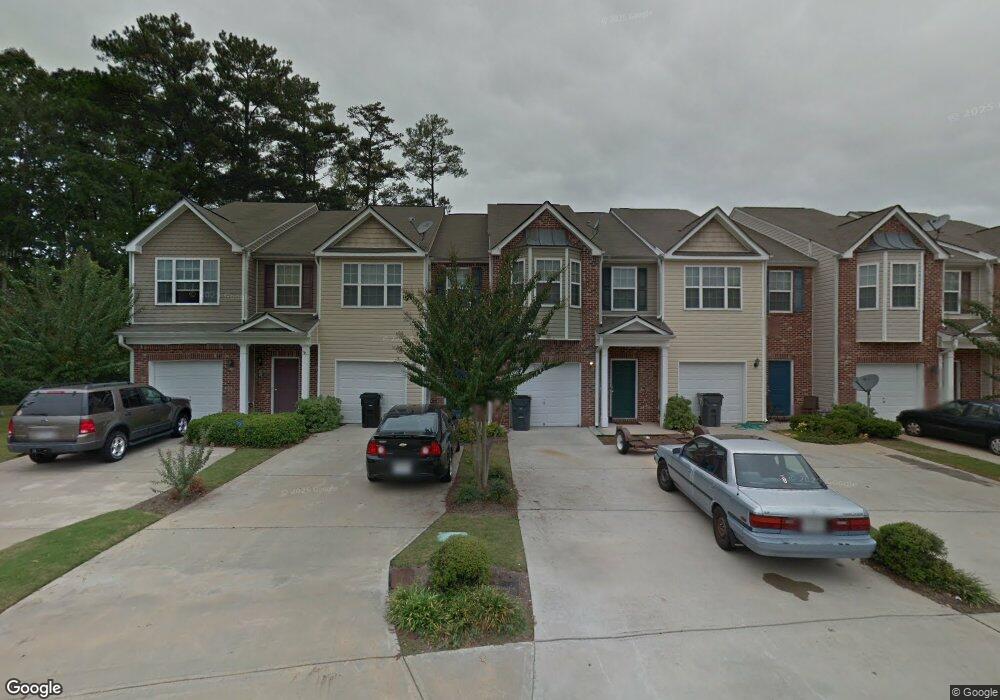
106 Chastain Cir Newnan, GA 30263
Estimated Value: $214,000 - $243,248
3
Beds
3
Baths
1,548
Sq Ft
$148/Sq Ft
Est. Value
About This Home
This home is located at 106 Chastain Cir, Newnan, GA 30263 and is currently estimated at $229,562, approximately $148 per square foot. 106 Chastain Cir is a home located in Coweta County with nearby schools including White Oak Elementary School, Arnall Middle School, and East Coweta High School.
Ownership History
Date
Name
Owned For
Owner Type
Purchase Details
Closed on
Jun 17, 2019
Sold by
Aponte Juan L
Bought by
Desai Shashikant A and Desai Jyotibala S
Current Estimated Value
Purchase Details
Closed on
Sep 29, 2006
Sold by
Meyer-Sutton Homes Inc
Bought by
Santiago Melissa and Aponte Juan
Home Financials for this Owner
Home Financials are based on the most recent Mortgage that was taken out on this home.
Original Mortgage
$129,972
Interest Rate
6.48%
Mortgage Type
FHA
Purchase Details
Closed on
May 13, 2005
Sold by
Meyer-Sutton Land Acquitision
Bought by
Meyer-Sutton Homes Inc
Purchase Details
Closed on
Jun 27, 2003
Sold by
Chastain Park Communities Llc
Bought by
Meyer-Sutton Land Acquitision Inc
Purchase Details
Closed on
Jan 26, 2001
Sold by
Southern Crescent Com
Bought by
Chastain Park Communities Llc
Create a Home Valuation Report for This Property
The Home Valuation Report is an in-depth analysis detailing your home's value as well as a comparison with similar homes in the area
Home Values in the Area
Average Home Value in this Area
Purchase History
| Date | Buyer | Sale Price | Title Company |
|---|---|---|---|
| Desai Shashikant A | $118,000 | -- | |
| Santiago Melissa | $131,000 | -- | |
| Meyer-Sutton Homes Inc | -- | -- | |
| Meyer-Sutton Land Acquitision Inc | $861,000 | -- | |
| Chastain Park Communities Llc | -- | -- |
Source: Public Records
Mortgage History
| Date | Status | Borrower | Loan Amount |
|---|---|---|---|
| Previous Owner | Santiago Melissa | $129,972 |
Source: Public Records
Tax History Compared to Growth
Tax History
| Year | Tax Paid | Tax Assessment Tax Assessment Total Assessment is a certain percentage of the fair market value that is determined by local assessors to be the total taxable value of land and additions on the property. | Land | Improvement |
|---|---|---|---|---|
| 2024 | $1,979 | $86,621 | $20,000 | $66,621 |
| 2023 | $1,979 | $83,437 | $16,000 | $67,437 |
| 2022 | $1,737 | $71,410 | $16,000 | $55,410 |
| 2021 | $1,658 | $61,695 | $12,000 | $49,695 |
| 2020 | $1,297 | $47,200 | $10,539 | $36,661 |
| 2019 | $1,280 | $42,604 | $8,000 | $34,604 |
| 2018 | $1,288 | $42,604 | $8,000 | $34,604 |
| 2017 | $1,132 | $37,604 | $3,000 | $34,604 |
| 2016 | $1,001 | $33,236 | $3,000 | $30,236 |
| 2015 | $678 | $22,486 | $3,000 | $19,486 |
| 2014 | $611 | $22,486 | $3,000 | $19,486 |
Source: Public Records
Map
Nearby Homes
- 123 Chastain Cir
- 81 Chastain Cir
- 21 Umber Ln Unit LOT 24
- 22 Umber Ln Unit LOT 8
- 23 Umber Ln Unit LOT 23
- 19 Umber Ln Unit LOT 25
- 17 Umber Ln Unit LOT 26
- 8 Umber Ln Unit LOT 2
- 12 Umber Ln Unit LOT 4
- 40 Umber Ln Unit LOT 14
- 6 Umber Ln Unit LOT 1
- Springdale Plan at The Retreat at Brown's Ridge - The Retreat at Browns Ridge
- Boxwood Plan at The Retreat at Brown's Ridge - The Retreat at Browns Ridge
- Emory Plan at The Retreat at Brown's Ridge - The Retreat at Browns Ridge
- McIntosh Plan at The Retreat at Brown's Ridge - The Retreat at Browns Ridge
- Sullivan Plan at The Retreat at Brown's Ridge - The Retreat at Browns Ridge
- Bramblewood Plan at The Retreat at Brown's Ridge - The Retreat at Browns Ridge
- Waterford Plan at The Retreat at Brown's Ridge - The Retreat at Browns Ridge
- 145 Greison Trail
- 139 Greison Trail
- 108 Chastain Cir
- 104 Chastain Cir
- 110 Chastain Cir
- 102 Chastain Cir
- 112 Chastain Cir
- 96 Chastain Cir
- 120 Chastain Cir
- 94 Chastain Cir
- 122 Chastain Cir
- 92 Chastain Cir
- 119 Chastain Cir
- 124 Chastain Cir
- 90 Chastain Cir
- 93 Chastain Cir
- 126 Chastain Cir
- 88 Chastain Cir
- 121 Chastain Cir
- 91 Chastain Cir
- 128 Chastain Cir
- 86 Chastain Cir