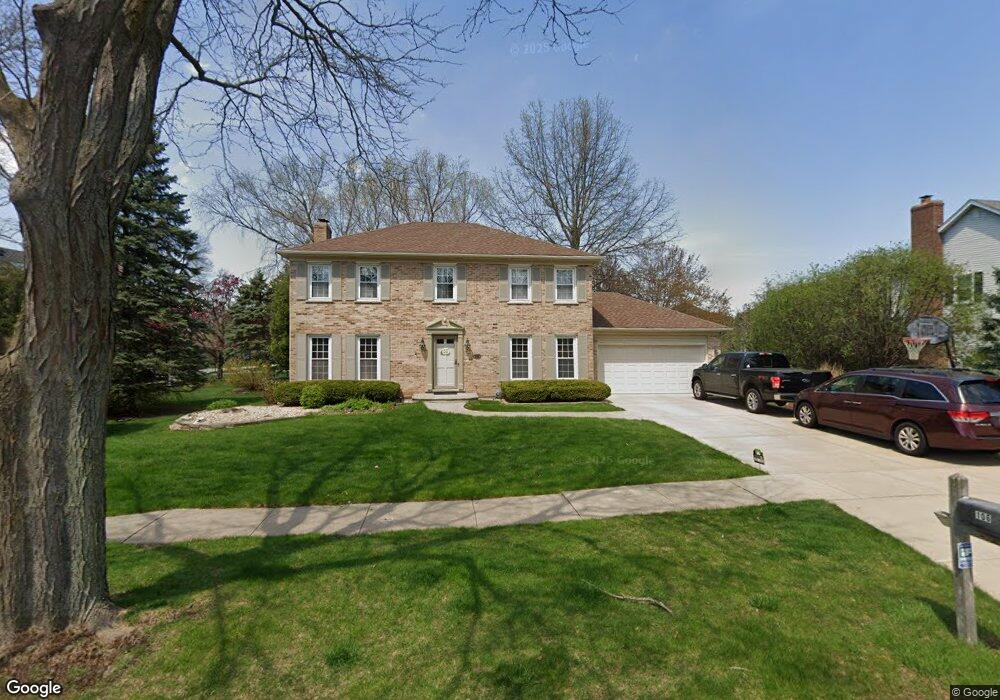
106 Christina Cir Wheaton, IL 60189
North Danada NeighborhoodEstimated Value: $638,132 - $794,000
4
Beds
3
Baths
2,188
Sq Ft
$331/Sq Ft
Est. Value
About This Home
This home is located at 106 Christina Cir, Wheaton, IL 60189 and is currently estimated at $723,783, approximately $330 per square foot. 106 Christina Cir is a home located in DuPage County with nearby schools including Lincoln Elementary School, Haines Elementary School, and Nelson Prairie School.
Ownership History
Date
Name
Owned For
Owner Type
Purchase Details
Closed on
Oct 19, 2004
Sold by
Racklyeft Thomas and Dvorak Racklyeft Patricia A
Bought by
Pepke Daniel L and Pepke Laura L
Current Estimated Value
Home Financials for this Owner
Home Financials are based on the most recent Mortgage that was taken out on this home.
Original Mortgage
$295,000
Outstanding Balance
$146,882
Interest Rate
5.85%
Mortgage Type
Purchase Money Mortgage
Estimated Equity
$576,901
Purchase Details
Closed on
Nov 16, 1995
Sold by
Stiegal Mark F and Stiegal Kathleen A
Bought by
Racklyeft Thomas and Dvorak Racklyeft Patricia A
Home Financials for this Owner
Home Financials are based on the most recent Mortgage that was taken out on this home.
Original Mortgage
$130,000
Interest Rate
7.56%
Create a Home Valuation Report for This Property
The Home Valuation Report is an in-depth analysis detailing your home's value as well as a comparison with similar homes in the area
Home Values in the Area
Average Home Value in this Area
Purchase History
| Date | Buyer | Sale Price | Title Company |
|---|---|---|---|
| Pepke Daniel L | $448,000 | Atg | |
| Racklyeft Thomas | $285,000 | Intercounty Title |
Source: Public Records
Mortgage History
| Date | Status | Borrower | Loan Amount |
|---|---|---|---|
| Open | Pepke Daniel L | $295,000 | |
| Previous Owner | Racklyeft Thomas | $130,000 |
Source: Public Records
Tax History Compared to Growth
Tax History
| Year | Tax Paid | Tax Assessment Tax Assessment Total Assessment is a certain percentage of the fair market value that is determined by local assessors to be the total taxable value of land and additions on the property. | Land | Improvement |
|---|---|---|---|---|
| 2024 | $11,234 | $182,298 | $51,767 | $130,531 |
| 2023 | $10,799 | $167,800 | $47,650 | $120,150 |
| 2022 | $10,567 | $158,580 | $45,030 | $113,550 |
| 2021 | $10,533 | $154,820 | $43,960 | $110,860 |
| 2020 | $10,501 | $153,380 | $43,550 | $109,830 |
| 2019 | $10,261 | $149,330 | $42,400 | $106,930 |
| 2018 | $10,948 | $157,150 | $71,120 | $86,030 |
| 2017 | $10,788 | $151,360 | $68,500 | $82,860 |
| 2016 | $10,648 | $145,310 | $65,760 | $79,550 |
| 2015 | $10,571 | $138,630 | $62,740 | $75,890 |
| 2014 | $10,003 | $129,370 | $62,310 | $67,060 |
| 2013 | $9,746 | $129,760 | $62,500 | $67,260 |
Source: Public Records
Map
Nearby Homes
- 1150 Mount Vernon Ct Unit C
- 1010 Heathrow Ct
- 1547 Huntleigh Dr
- 1631 Southampton Ct
- 24 Winners Cup Cir Unit 3
- 1129 Rhodes Ct
- 1026 Briarcliffe Blvd
- 30 Danada Dr
- 1038 Liskeard Ct
- 1751 Plymouth Ct Unit B
- 1244 Loughborough Ct
- 1581 Groton Ln
- 1888 Cheshire Ln
- 141 Loretto Ct
- 512 Pershing Ave
- 909 S Main St
- 1219 Golf Ln
- 215 Orchard Ln
- 2214 Kingston Dr
- 2231 S Bradford Dr
- 1731 Austin Ct
- 110 Christina Cir
- 1727 Austin Ct
- 700 Bluegrass Dr
- 109 Christina Cir
- 105 Christina Cir
- 111 Christina Cir
- 1721 Austin Ct
- 1728 Austin Ct
- 97 Christina Cir
- 101 Christina Cir
- 630 Bluegrass Dr
- 115 Christina Cir
- 709 Bluegrass Dr
- 1720 Austin Ct
- 600 Bluegrass Dr
- 93 Christina Cir
- 119 Christina Cir
- 1724 Austin Ct
- 705 Bluegrass Dr