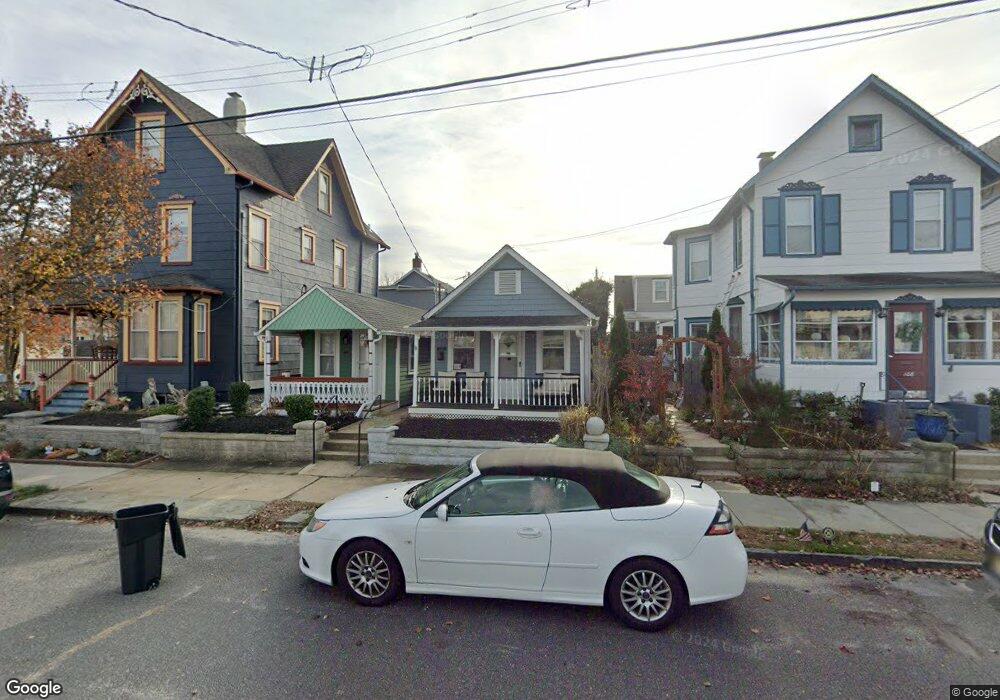
106 Cookman Ave Ocean Grove, NJ 07756
Estimated Value: $400,000 - $461,356
1
Bed
1
Bath
1,216
Sq Ft
$363/Sq Ft
Est. Value
About This Home
This home is located at 106 Cookman Ave, Ocean Grove, NJ 07756 and is currently estimated at $441,339, approximately $362 per square foot. 106 Cookman Ave is a home located in Monmouth County with nearby schools including Neptune High School, Hope Academy Charter School, and Our Lady of Mount Carmel School.
Ownership History
Date
Name
Owned For
Owner Type
Purchase Details
Closed on
Mar 15, 2018
Sold by
Stovall Jermaine and Armour Shanna
Bought by
Jones Ellis E and Jones Karen N
Current Estimated Value
Home Financials for this Owner
Home Financials are based on the most recent Mortgage that was taken out on this home.
Original Mortgage
$218,960
Outstanding Balance
$189,245
Interest Rate
4.75%
Mortgage Type
FHA
Estimated Equity
$252,094
Purchase Details
Closed on
Jul 26, 2017
Sold by
Va
Bought by
Stovall Jermaine and Armout Shanna
Purchase Details
Closed on
Oct 24, 2016
Sold by
Steele Wayne M and Steele Marcy L
Bought by
Midfirst Bank
Purchase Details
Closed on
Mar 30, 2015
Sold by
Steele Wayne
Bought by
Steele Marcy
Purchase Details
Closed on
Jul 10, 2000
Sold by
Esdaile Richard
Bought by
Steele Wayne and Steele Marcy
Home Financials for this Owner
Home Financials are based on the most recent Mortgage that was taken out on this home.
Original Mortgage
$96,900
Interest Rate
8.28%
Mortgage Type
VA
Create a Home Valuation Report for This Property
The Home Valuation Report is an in-depth analysis detailing your home's value as well as a comparison with similar homes in the area
Home Values in the Area
Average Home Value in this Area
Purchase History
| Date | Buyer | Sale Price | Title Company |
|---|---|---|---|
| Jones Ellis E | $223,000 | Two Rivers Title | |
| Stovall Jermaine | $88,600 | Fidelity National Title | |
| Midfirst Bank | -- | None Available | |
| Steele Marcy | -- | Attorney | |
| Steele Wayne | $95,000 | -- |
Source: Public Records
Mortgage History
| Date | Status | Borrower | Loan Amount |
|---|---|---|---|
| Open | Jones Ellis E | $218,960 | |
| Previous Owner | Steele Wayne | $96,900 |
Source: Public Records
Tax History Compared to Growth
Tax History
| Year | Tax Paid | Tax Assessment Tax Assessment Total Assessment is a certain percentage of the fair market value that is determined by local assessors to be the total taxable value of land and additions on the property. | Land | Improvement |
|---|---|---|---|---|
| 2025 | $6,766 | $390,100 | $198,400 | $191,700 |
| 2024 | $6,119 | $386,400 | $170,000 | $216,400 |
| 2023 | $6,119 | $338,800 | $127,500 | $211,300 |
| 2022 | $5,118 | $290,800 | $83,000 | $207,800 |
| 2021 | $5,118 | $242,200 | $69,000 | $173,200 |
| 2020 | $4,821 | $227,600 | $63,500 | $164,100 |
| 2019 | $4,792 | $223,400 | $69,500 | $153,900 |
| 2018 | $3,672 | $169,200 | $69,500 | $99,700 |
| 2017 | $3,723 | $164,800 | $72,500 | $92,300 |
| 2016 | $3,701 | $163,400 | $72,500 | $90,900 |
| 2015 | $3,243 | $145,600 | $57,000 | $88,600 |
| 2014 | $2,915 | $107,600 | $46,500 | $61,100 |
Source: Public Records
Map
Nearby Homes
- 128 Broadway
- 139 Cookman Ave
- 139 Stockton Ave
- 137 Inskip Ave
- 140 Stockton Ave
- 146 Inskip Ave
- 77 Stockton Ave
- 147 Webb Ave
- 69 Stockton Ave
- 69 Webb Ave
- 1003 Hammond Ave
- 93 Central Ave
- 56 Embury Ave
- 219 Lake Terrace
- 77 Main Ave Unit 2B
- 77 Main Ave Unit 2A
- 52 Embury Ave
- 66 Main Ave
- 110 Mount Tabor Way
- 217 Newark Ave
- 106 Cookman Ave Unit AVE 1/2
- 108 Cookman Ave
- 104 Cookman Ave
- 110 Cookman Ave
- 107 Clark Ave
- 105 Clark Ave
- 103 Clark Ave
- 109 Clark Ave
- 112 Cookman Ave
- 111 Clark Ave
- 102 Cookman Ave
- 107 Cookman Ave Unit AVE 1/2
- 107 Cookman Ave
- 105 Cookman Ave
- 114 Cookman Ave
- 103 Cookman Ave
- 101 Clark Ave
- 113 Clark Ave
- 109 Cookman Ave
- 100 Cookman Ave