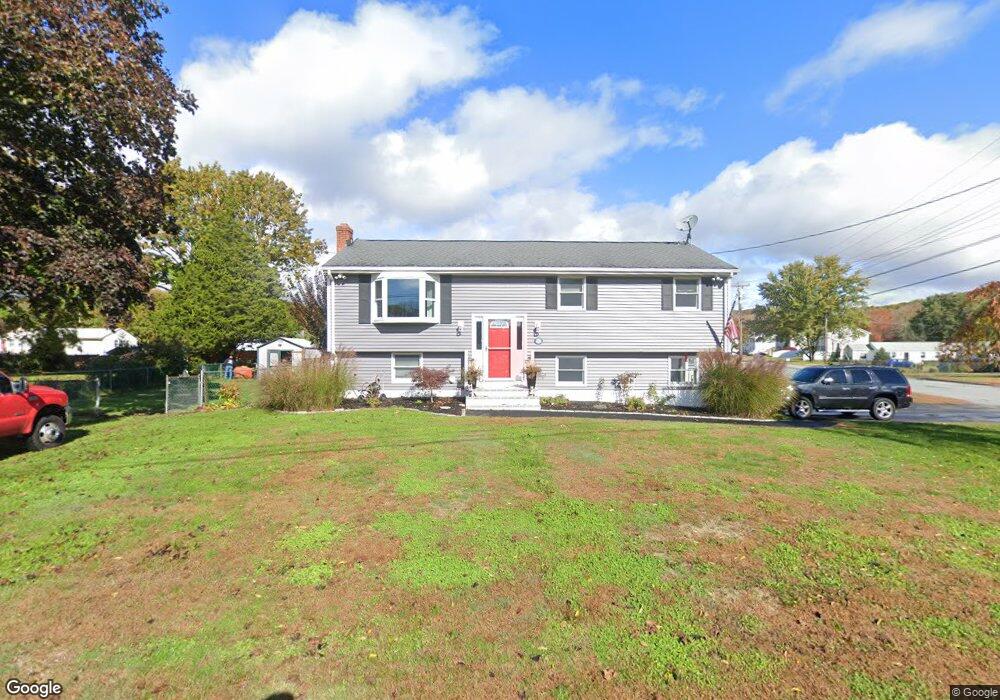
106 Corey Rd Groton, CT 06340
Estimated Value: $339,000 - $384,000
3
Beds
2
Baths
1,275
Sq Ft
$286/Sq Ft
Est. Value
About This Home
This home is located at 106 Corey Rd, Groton, CT 06340 and is currently estimated at $365,207, approximately $286 per square foot. 106 Corey Rd is a home located in New London County with nearby schools including Claude Chester School, Groton Middle School, and Robert E. Fitch High School.
Ownership History
Date
Name
Owned For
Owner Type
Purchase Details
Closed on
Feb 25, 2019
Sold by
Johnson Barbara J
Bought by
Johnson Ronald K
Current Estimated Value
Home Financials for this Owner
Home Financials are based on the most recent Mortgage that was taken out on this home.
Original Mortgage
$232,702
Outstanding Balance
$208,009
Interest Rate
5.75%
Mortgage Type
FHA
Estimated Equity
$157,198
Purchase Details
Closed on
Sep 20, 2000
Sold by
Griggs Sandra F
Bought by
Johnson David S and Johnson Alice M
Purchase Details
Closed on
Oct 5, 1993
Sold by
Hayden Delbert W and Patrick Debra Jean
Bought by
Griggs Harold L and Griggs Sandra
Purchase Details
Closed on
Jan 22, 1987
Sold by
Johnson Harry C
Bought by
Hayden Delbert W
Create a Home Valuation Report for This Property
The Home Valuation Report is an in-depth analysis detailing your home's value as well as a comparison with similar homes in the area
Home Values in the Area
Average Home Value in this Area
Purchase History
| Date | Buyer | Sale Price | Title Company |
|---|---|---|---|
| Johnson Ronald K | -- | -- | |
| Johnson David S | $112,000 | -- | |
| Griggs Harold L | $54,250 | -- | |
| Griggs Harold L | $54,250 | -- | |
| Hayden Delbert W | $105,000 | -- |
Source: Public Records
Mortgage History
| Date | Status | Borrower | Loan Amount |
|---|---|---|---|
| Open | Johnson Ronald K | $232,702 | |
| Previous Owner | Hayden Delbert W | $103,100 | |
| Previous Owner | Hayden Delbert W | $102,000 |
Source: Public Records
Tax History
| Year | Tax Paid | Tax Assessment Tax Assessment Total Assessment is a certain percentage of the fair market value that is determined by local assessors to be the total taxable value of land and additions on the property. | Land | Improvement |
|---|---|---|---|---|
| 2025 | $5,158 | $174,790 | $73,703 | $101,087 |
| 2024 | $4,856 | $174,790 | $73,703 | $101,087 |
| 2023 | $4,760 | $174,790 | $30,380 | $144,410 |
| 2022 | $4,649 | $174,790 | $30,380 | $144,410 |
| 2021 | $4,018 | $123,760 | $30,380 | $93,380 |
| 2020 | $3,913 | $123,760 | $30,380 | $93,380 |
| 2019 | $3,768 | $123,760 | $30,380 | $93,380 |
| 2018 | $3,679 | $122,080 | $30,380 | $91,700 |
| 2017 | $3,584 | $122,080 | $30,380 | $91,700 |
| 2016 | $3,687 | $131,320 | $47,530 | $83,790 |
Source: Public Records
Map
Nearby Homes
- 3 Fort Hill Rd
- 32 Concord Ct
- 247 Midway Oval
- 209 Midway Oval
- 23 Ivy Hill Rd
- 182 Bel Aire Dr
- 351 Flanders Rd
- 70 Bel Aire Dr
- 301 Buddington Rd Unit LOT 24
- 1043 Poquonnock Rd
- 510 Flanders Rd
- 335 Judson Ave
- 174 D St
- 172 D St
- 224 Neptune Dr
- 10 B St
- 783 Buddington Rd
- 119 High Rock Rd
- 518 Noank Ledyard Rd
- 68 Mystic Meadow Ln
Your Personal Tour Guide
Ask me questions while you tour the home.