Estimated Value: $350,303 - $505,000
3
Beds
1
Bath
1,075
Sq Ft
$427/Sq Ft
Est. Value
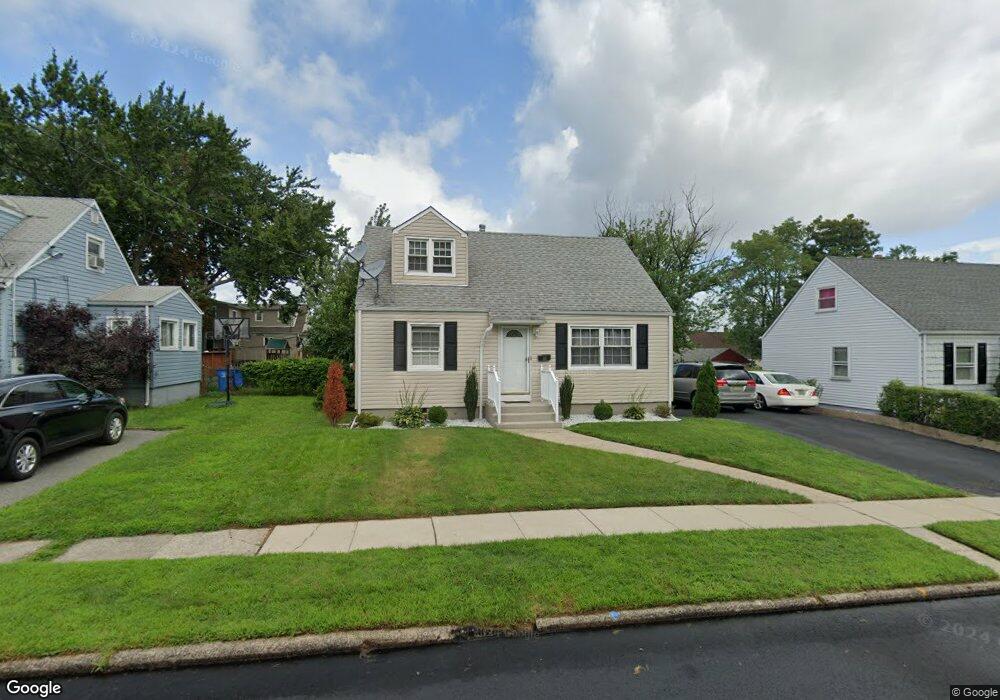
About This Home
This home is located at 106 Corey St, Fords, NJ 08863 and is currently estimated at $459,326, approximately $427 per square foot. 106 Corey St is a home located in Middlesex County with nearby schools including Menlo Park Terrace School, Fords Middle School, and Woodbridge High School.
Ownership History
Date
Name
Owned For
Owner Type
Purchase Details
Closed on
Apr 26, 2013
Sold by
Razzano General Construction Inc
Bought by
Bautista Berlin and Jabagat Novelita
Current Estimated Value
Home Financials for this Owner
Home Financials are based on the most recent Mortgage that was taken out on this home.
Original Mortgage
$250,381
Outstanding Balance
$177,581
Interest Rate
3.5%
Mortgage Type
FHA
Estimated Equity
$281,745
Create a Home Valuation Report for This Property
The Home Valuation Report is an in-depth analysis detailing your home's value as well as a comparison with similar homes in the area
Home Values in the Area
Average Home Value in this Area
Purchase History
| Date | Buyer | Sale Price | Title Company |
|---|---|---|---|
| Bautista Berlin | $255,000 | None Available |
Source: Public Records
Mortgage History
| Date | Status | Borrower | Loan Amount |
|---|---|---|---|
| Open | Bautista Berlin | $250,381 |
Source: Public Records
Tax History Compared to Growth
Tax History
| Year | Tax Paid | Tax Assessment Tax Assessment Total Assessment is a certain percentage of the fair market value that is determined by local assessors to be the total taxable value of land and additions on the property. | Land | Improvement |
|---|---|---|---|---|
| 2025 | $7,728 | $60,900 | $24,400 | $36,500 |
| 2024 | $7,534 | $60,900 | $24,400 | $36,500 |
| 2023 | $7,534 | $60,900 | $24,400 | $36,500 |
| 2022 | $7,317 | $60,900 | $24,400 | $36,500 |
| 2021 | $7,314 | $60,900 | $24,400 | $36,500 |
| 2020 | $7,061 | $60,900 | $24,400 | $36,500 |
| 2019 | $6,891 | $60,900 | $24,400 | $36,500 |
| 2018 | $6,736 | $60,900 | $24,400 | $36,500 |
| 2017 | $6,611 | $60,900 | $24,400 | $36,500 |
| 2016 | $6,544 | $60,900 | $24,400 | $36,500 |
| 2015 | $6,427 | $60,900 | $24,400 | $36,500 |
| 2014 | $6,258 | $60,900 | $24,400 | $36,500 |
Source: Public Records
Map
Nearby Homes
- 99 Crestview Rd
- 111 Longview Cir
- 1 Olive St
- 163 Winchester Rd
- 179 Liberty St
- 164 Pennsylvania Ave
- 450 Crows Mill Rd
- 12 Liberty St
- 133 Howard St
- 7 Clum Ave
- 59 Douglas St
- 29 S Columbus Ave
- 21 Douglas St
- 636 King Georges Rd
- 71 Pennsylvania Ave
- 10 Mary Ave
- 16 Emmett Ave
- 47 Harned Ave
- 6 Worden Ave
- 805 King Georges Rd