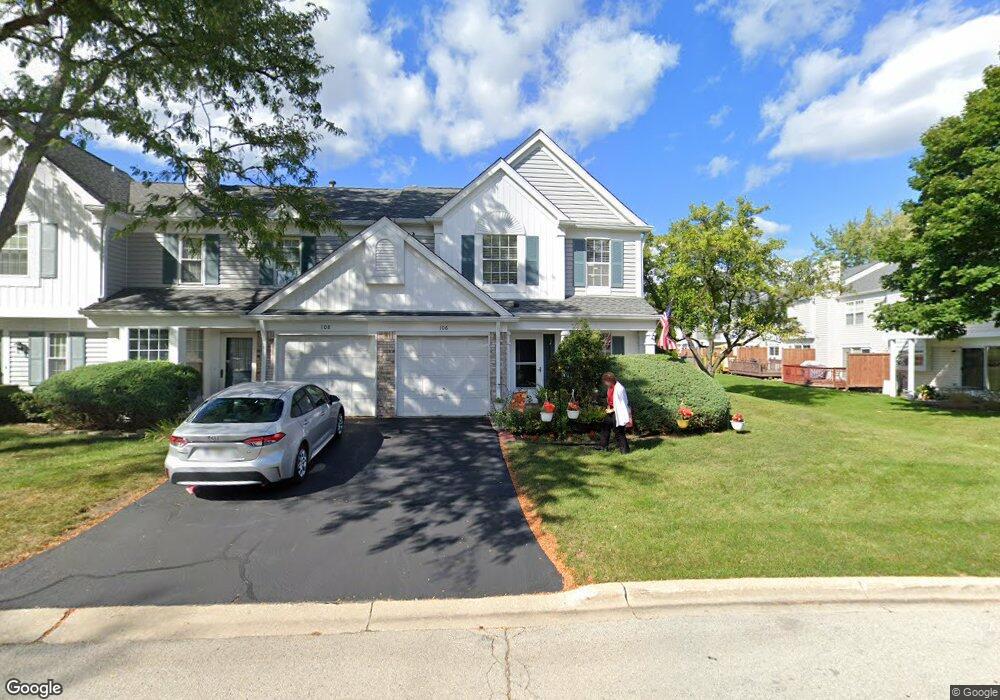
106 Crab Tree Dr Unit 108 Westmont, IL 60559
South Westmont NeighborhoodEstimated Value: $309,000 - $322,000
2
Beds
3
Baths
1,325
Sq Ft
$238/Sq Ft
Est. Value
About This Home
This home is located at 106 Crab Tree Dr Unit 108, Westmont, IL 60559 and is currently estimated at $315,682, approximately $238 per square foot. 106 Crab Tree Dr Unit 108 is a home located in DuPage County with nearby schools including Holmes Elementary School, Maercker Elementary School, and Westview Hills Middle School.
Ownership History
Date
Name
Owned For
Owner Type
Purchase Details
Closed on
Aug 12, 2011
Sold by
Swanson Lisa and Swanson Gregory J
Bought by
Sarkauskas Patricia
Current Estimated Value
Home Financials for this Owner
Home Financials are based on the most recent Mortgage that was taken out on this home.
Original Mortgage
$165,202
Outstanding Balance
$114,277
Interest Rate
4.55%
Mortgage Type
FHA
Estimated Equity
$201,405
Purchase Details
Closed on
Aug 10, 2005
Sold by
Citro Kathlyn M
Bought by
Schindler Lisa
Home Financials for this Owner
Home Financials are based on the most recent Mortgage that was taken out on this home.
Original Mortgage
$175,000
Interest Rate
5.82%
Mortgage Type
Fannie Mae Freddie Mac
Purchase Details
Closed on
Feb 23, 1998
Sold by
Carlo Gary W
Bought by
Citro Kathlyn M
Home Financials for this Owner
Home Financials are based on the most recent Mortgage that was taken out on this home.
Original Mortgage
$98,000
Interest Rate
6.95%
Mortgage Type
Purchase Money Mortgage
Create a Home Valuation Report for This Property
The Home Valuation Report is an in-depth analysis detailing your home's value as well as a comparison with similar homes in the area
Home Values in the Area
Average Home Value in this Area
Purchase History
| Date | Buyer | Sale Price | Title Company |
|---|---|---|---|
| Sarkauskas Patricia | $169,500 | Baird & Warner Title Service | |
| Schindler Lisa | $221,000 | Pntn | |
| Citro Kathlyn M | $128,000 | -- |
Source: Public Records
Mortgage History
| Date | Status | Borrower | Loan Amount |
|---|---|---|---|
| Open | Sarkauskas Patricia | $165,202 | |
| Previous Owner | Schindler Lisa | $175,000 | |
| Previous Owner | Citro Kathlyn M | $98,000 |
Source: Public Records
Tax History Compared to Growth
Tax History
| Year | Tax Paid | Tax Assessment Tax Assessment Total Assessment is a certain percentage of the fair market value that is determined by local assessors to be the total taxable value of land and additions on the property. | Land | Improvement |
|---|---|---|---|---|
| 2024 | $4,898 | $80,770 | $19,559 | $61,211 |
| 2023 | $4,666 | $74,250 | $17,980 | $56,270 |
| 2022 | $4,304 | $67,430 | $16,330 | $51,100 |
| 2021 | $4,161 | $66,660 | $16,140 | $50,520 |
| 2020 | $4,080 | $65,340 | $15,820 | $49,520 |
| 2019 | $3,953 | $62,690 | $15,180 | $47,510 |
| 2018 | $3,482 | $54,510 | $13,200 | $41,310 |
| 2017 | $3,284 | $52,450 | $12,700 | $39,750 |
| 2016 | $3,211 | $50,060 | $12,120 | $37,940 |
| 2015 | $3,151 | $47,090 | $11,400 | $35,690 |
| 2014 | $3,637 | $53,230 | $12,880 | $40,350 |
| 2013 | $3,526 | $52,980 | $12,820 | $40,160 |
Source: Public Records
Map
Nearby Homes
- 6655 S Cass Ave Unit 5D
- 61 Pier Dr Unit 202
- 47 W Pier Dr Unit 102
- 1116 Bristlecone Ct
- 55 W 64th St Unit 202
- 67 W 64th St Unit 101
- 55 W 64th St Unit 102
- 1313 Cass Ln E Unit 301
- 1145 Lacebark Ct
- 1121 Lodgepole Ct
- 220 Memory Ln Unit 3
- 1409 S Williams St
- 1301 S Williams St Unit 2
- 1408 Spruce Ln
- 824 High Ridge Ct
- 1813 Kelly Ct
- 1205 Charleston Ct Unit 1205
- 6722 Sweetbriar Ln
- 245 Carlisle Ave
- 1017 Fordham Way
- 108 Crab Tree Dr
- 110 Crab Tree Dr
- 112 Crab Tree Dr
- 1526 Harvest Ln
- 1524 Harvest Ln
- 1522 Harvest Ln
- 114 Crab Tree Dr
- 1520 Harvest Ln
- 105 Crab Tree Dr
- 107 Crab Tree Dr
- 109 Crab Tree Dr
- 1518 Harvest Ln
- 1525 Plum Ln
- 116 Crab Tree Dr
- 111 Crab Tree Dr
- 1523 Plum Ln
- 107 Peach Tree Ln
- 105 Peach Tree Ln
- 1516 Harvest Ln
- 113 Crab Tree Dr