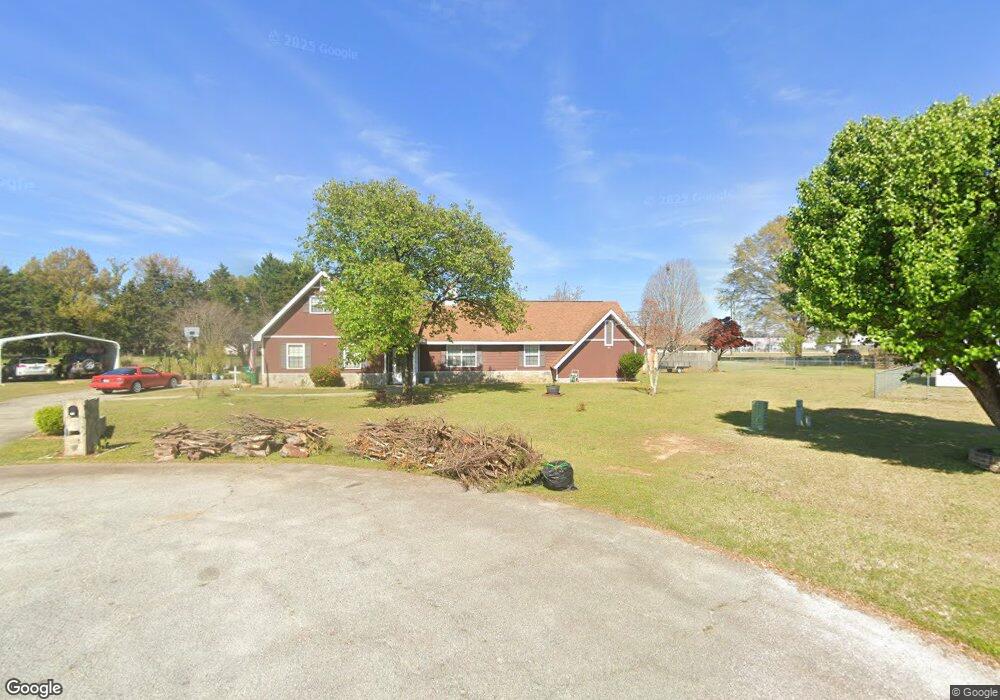
106 Crane Ct Warner Robins, GA 31088
Estimated Value: $249,729 - $263,000
3
Beds
2
Baths
1,828
Sq Ft
$140/Sq Ft
Est. Value
About This Home
This home is located at 106 Crane Ct, Warner Robins, GA 31088 and is currently estimated at $256,432, approximately $140 per square foot. 106 Crane Ct is a home located in Houston County with nearby schools including Lake Joy Primary School, Lake Joy Elementary School, and Mossy Creek Middle School.
Ownership History
Date
Name
Owned For
Owner Type
Purchase Details
Closed on
Sep 8, 2006
Sold by
Horn Timothy B and Horn Allison D
Bought by
Upchurch Andrew L and Upchurch Tracie M
Current Estimated Value
Home Financials for this Owner
Home Financials are based on the most recent Mortgage that was taken out on this home.
Original Mortgage
$108,000
Outstanding Balance
$64,540
Interest Rate
6.58%
Mortgage Type
New Conventional
Estimated Equity
$191,892
Purchase Details
Closed on
Sep 5, 2003
Sold by
Michael Norman C and Michael Terry G
Bought by
Horn Timothy B and Allison D*
Purchase Details
Closed on
Apr 22, 1993
Sold by
Spada Celio J and Spada Lisa L
Bought by
Michael Norman C and Michael Terry G
Purchase Details
Closed on
Nov 1, 1988
Sold by
Sussex Construction Company Inc
Bought by
Spada Celio J and Spada Lisa L
Purchase Details
Closed on
Aug 16, 1988
Sold by
Pioneer Holdings & Development Inc
Bought by
Sussex Construction Company Inc
Create a Home Valuation Report for This Property
The Home Valuation Report is an in-depth analysis detailing your home's value as well as a comparison with similar homes in the area
Home Values in the Area
Average Home Value in this Area
Purchase History
| Date | Buyer | Sale Price | Title Company |
|---|---|---|---|
| Upchurch Andrew L | $135,000 | None Available | |
| Horn Timothy B | $121,000 | -- | |
| Michael Norman C | $81,500 | -- | |
| Spada Celio J | -- | -- | |
| Sussex Construction Company Inc | -- | -- |
Source: Public Records
Mortgage History
| Date | Status | Borrower | Loan Amount |
|---|---|---|---|
| Open | Upchurch Andrew L | $108,000 | |
| Closed | Upchurch Andrew L | $27,000 |
Source: Public Records
Tax History Compared to Growth
Tax History
| Year | Tax Paid | Tax Assessment Tax Assessment Total Assessment is a certain percentage of the fair market value that is determined by local assessors to be the total taxable value of land and additions on the property. | Land | Improvement |
|---|---|---|---|---|
| 2024 | $1,688 | $70,560 | $10,800 | $59,760 |
| 2023 | $1,521 | $62,920 | $10,800 | $52,120 |
| 2022 | $1,484 | $61,400 | $10,800 | $50,600 |
| 2021 | $1,406 | $57,880 | $10,800 | $47,080 |
| 2020 | $1,303 | $53,400 | $8,400 | $45,000 |
| 2019 | $1,303 | $53,400 | $8,400 | $45,000 |
| 2018 | $1,303 | $53,400 | $8,400 | $45,000 |
| 2017 | $1,305 | $53,400 | $8,400 | $45,000 |
| 2016 | $1,233 | $50,400 | $8,400 | $42,000 |
| 2015 | $1,236 | $50,400 | $8,400 | $42,000 |
| 2014 | -- | $50,400 | $8,400 | $42,000 |
| 2013 | -- | $50,560 | $8,400 | $42,160 |
Source: Public Records
Map
Nearby Homes
- 743 Lake Joy Rd
- 104 Crane Ct
- 107 Crane Ct
- 741 Lake Joy Rd
- 105 Crane Ct
- 102 Crane Ct
- 739 Lake Joy Rd
- 745 Lake Joy Rd
- 103 Crane Ct
- 102 Ichabod Close
- 114 Sleepy Ln
- 903 Broderick Cir
- 102 Sleepy Ln
- 737 Lake Joy Rd
- 112 Sleepy Ln
- 104 Cheshire Dr
- 104 Cheshire Dr Unit 3F
- 101 Crane Ct
- 106 Cheshire Dr
- 102 Cheshire Dr