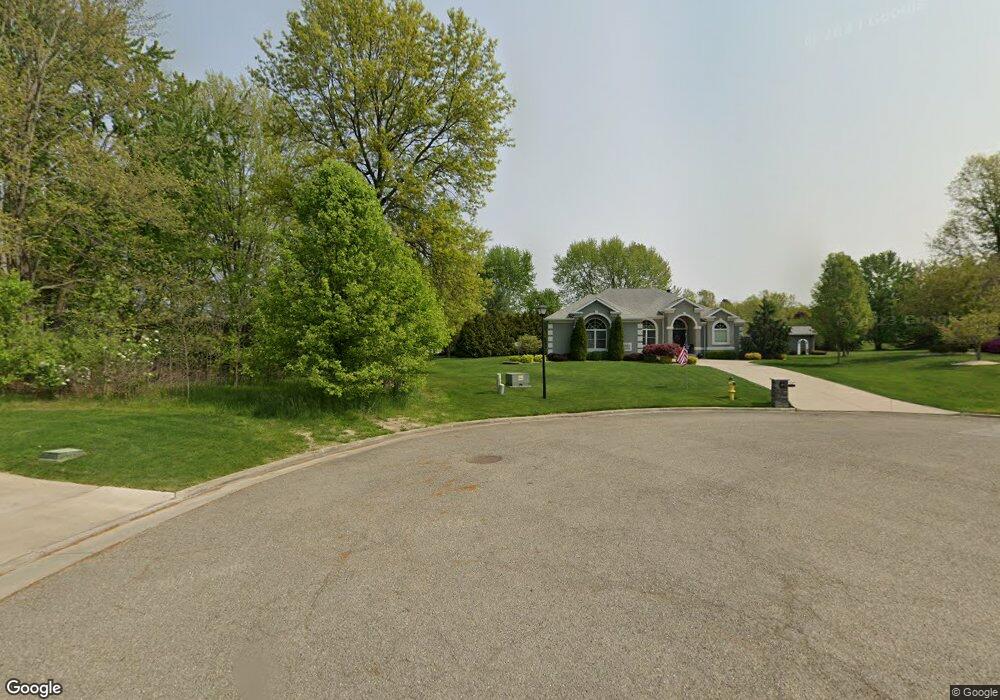
106 Crosswinds Ct NE Warren, OH 44484
Estimated Value: $377,000 - $457,000
3
Beds
2
Baths
2,246
Sq Ft
$190/Sq Ft
Est. Value
About This Home
This home is located at 106 Crosswinds Ct NE, Warren, OH 44484 and is currently estimated at $426,167, approximately $189 per square foot. 106 Crosswinds Ct NE is a home located in Trumbull County with nearby schools including Howland High School, John F. Kennedy Catholic School - Lower Campus, and Holy Trinity Orthodox Christian Academy.
Ownership History
Date
Name
Owned For
Owner Type
Purchase Details
Closed on
Aug 6, 2009
Sold by
Griffin Robert L and Griffin Cynthia R
Bought by
Tatar Ii Paul J and Tatar Melissa M
Current Estimated Value
Home Financials for this Owner
Home Financials are based on the most recent Mortgage that was taken out on this home.
Original Mortgage
$275,742
Outstanding Balance
$182,336
Interest Rate
5.49%
Mortgage Type
FHA
Estimated Equity
$243,831
Purchase Details
Closed on
Aug 11, 2006
Sold by
P M D Builders Ltd
Bought by
Griffin Robert L and Griffin Cynthia R
Purchase Details
Closed on
Aug 10, 2006
Sold by
P M D Builders Ltd
Bought by
Griffin Robert L and Griffin Cynthia R
Purchase Details
Closed on
Mar 21, 2006
Sold by
Safos Robert S
Bought by
P M D Builders Ltd
Purchase Details
Closed on
Feb 23, 2006
Sold by
Safos Robert S
Bought by
P M D Builders Ltd
Create a Home Valuation Report for This Property
The Home Valuation Report is an in-depth analysis detailing your home's value as well as a comparison with similar homes in the area
Home Values in the Area
Average Home Value in this Area
Purchase History
| Date | Buyer | Sale Price | Title Company |
|---|---|---|---|
| Tatar Ii Paul J | $286,000 | Attorney | |
| Griffin Robert L | $240,000 | None Available | |
| Griffin Robert L | $240,000 | None Available | |
| P M D Builders Ltd | $49,500 | None Available | |
| P M D Builders Ltd | $49,500 | None Available |
Source: Public Records
Mortgage History
| Date | Status | Borrower | Loan Amount |
|---|---|---|---|
| Open | Tatar Ii Paul J | $275,742 |
Source: Public Records
Tax History Compared to Growth
Tax History
| Year | Tax Paid | Tax Assessment Tax Assessment Total Assessment is a certain percentage of the fair market value that is determined by local assessors to be the total taxable value of land and additions on the property. | Land | Improvement |
|---|---|---|---|---|
| 2024 | $6,811 | $125,730 | $22,090 | $103,640 |
| 2023 | $6,811 | $125,730 | $22,090 | $103,640 |
| 2022 | $6,420 | $99,790 | $19,850 | $79,940 |
| 2021 | $6,275 | $99,790 | $19,850 | $79,940 |
| 2020 | $6,299 | $99,790 | $19,850 | $79,940 |
| 2019 | $6,159 | $92,410 | $18,380 | $74,030 |
| 2018 | $5,899 | $92,410 | $18,380 | $74,030 |
| 2017 | $5,317 | $92,410 | $18,380 | $74,030 |
| 2016 | $5,072 | $85,680 | $18,480 | $67,200 |
| 2015 | $4,950 | $85,680 | $18,480 | $67,200 |
| 2014 | $4,777 | $85,680 | $18,480 | $67,200 |
| 2013 | $4,748 | $85,680 | $18,480 | $67,200 |
Source: Public Records
Map
Nearby Homes
- 108 Westwind Dr NE
- 610 Clifton Dr NE
- 7979 Brookwood St NE
- 741 Shady Ln NE
- 660 Rosegarden Dr NE
- 8528 Deer Creek Ln NE
- 8531 Red Oak Dr NE
- 7751 Castle Rock Dr NE
- 8052 Castle Rock Dr NE
- 8545 Carriage Hill Dr NE
- 248 Darlington Rd NE
- 7707 Raglan Dr NE
- 8303 E Market St
- 6 Niles Cortland Rd NE
- 8530 E Market St
- 0 King Graves Rd NE
- 7697 Micawber Rd NE
- 428 Wheelock Dr NE
- 7837 Raglan Dr NE
- 414 Wheelock Dr NE
- 108 Crosswinds Ct NE
- 113 Eastwind Dr NE
- 111 Eastwind Dr NE
- 115 Eastwind Dr NE
- 109 Eastwind Dr NE
- 117 Eastwind Dr NE
- 114 Westwind Dr NE
- 104 Westwind Dr NE
- 110 Westwind Dr NE
- 102 Crosswinds Ct NE
- 105 Eastwind Dr NE
- 116 Westwind Dr NE
- 119 Eastwind Dr NE
- 101 Eastwind Dr NE
- 118 Westwind Dr NE
- 110 Eastwind Dr NE
- 112 Eastwind Dr NE
- 114 Eastwind Dr NE
- 108 Eastwind Dr NE
- 121 Eastwind Dr NE