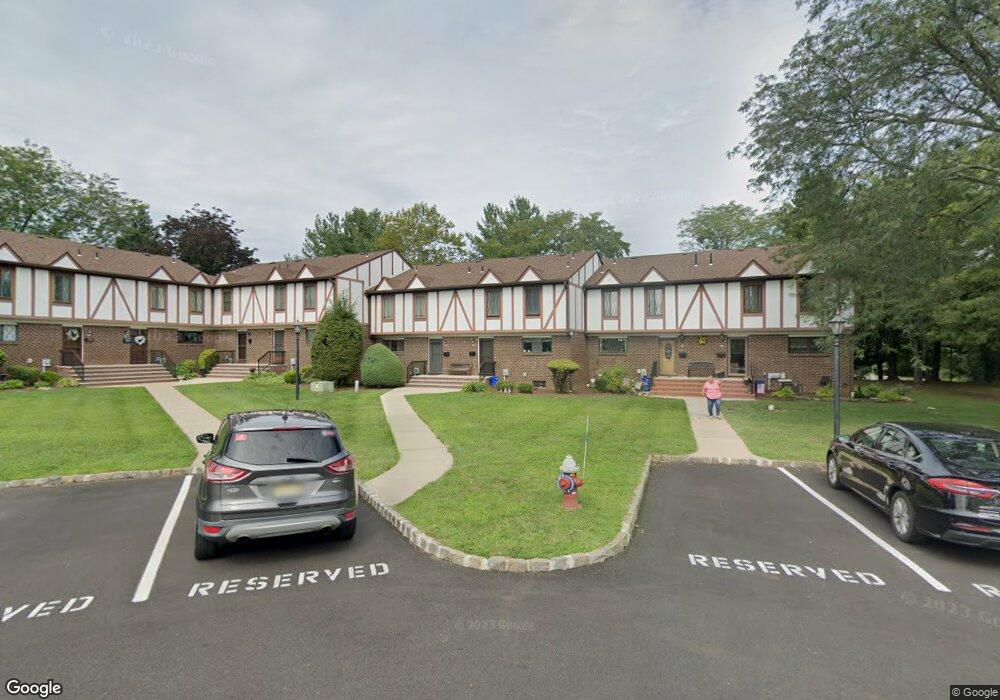
106 Devonshire Ct Unit 106 Hillsborough, NJ 08844
Estimated Value: $413,074 - $449,000
--
Bed
--
Bath
1,551
Sq Ft
$279/Sq Ft
Est. Value
About This Home
This home is located at 106 Devonshire Ct Unit 106, Hillsborough, NJ 08844 and is currently estimated at $432,519, approximately $278 per square foot. 106 Devonshire Ct Unit 106 is a home located in Somerset County with nearby schools including Hillsborough High School, Cherry Blossom Montessori School, and Brighthorizons at Hillsborough.
Ownership History
Date
Name
Owned For
Owner Type
Purchase Details
Closed on
Jun 12, 2007
Sold by
Riley John H
Bought by
Riley Candida R
Current Estimated Value
Home Financials for this Owner
Home Financials are based on the most recent Mortgage that was taken out on this home.
Original Mortgage
$195,200
Outstanding Balance
$119,118
Interest Rate
6.14%
Mortgage Type
Purchase Money Mortgage
Estimated Equity
$313,401
Purchase Details
Closed on
Jul 19, 2000
Sold by
Whyte Erroll
Bought by
Riley John and Riley Candida
Home Financials for this Owner
Home Financials are based on the most recent Mortgage that was taken out on this home.
Original Mortgage
$135,700
Interest Rate
8.1%
Mortgage Type
FHA
Purchase Details
Closed on
Jun 28, 1995
Sold by
Thompson Brenda
Bought by
Whyte Errol and Whyte Maureen
Home Financials for this Owner
Home Financials are based on the most recent Mortgage that was taken out on this home.
Original Mortgage
$95,000
Interest Rate
7.84%
Create a Home Valuation Report for This Property
The Home Valuation Report is an in-depth analysis detailing your home's value as well as a comparison with similar homes in the area
Home Values in the Area
Average Home Value in this Area
Purchase History
| Date | Buyer | Sale Price | Title Company |
|---|---|---|---|
| Riley Candida R | $8,000 | Camelot Title Agency | |
| Riley John | $139,900 | -- | |
| Whyte Errol | $100,000 | -- |
Source: Public Records
Mortgage History
| Date | Status | Borrower | Loan Amount |
|---|---|---|---|
| Open | Riley Candida R | $195,200 | |
| Closed | Riley John | $135,700 | |
| Previous Owner | Whyte Errol | $95,000 |
Source: Public Records
Tax History Compared to Growth
Tax History
| Year | Tax Paid | Tax Assessment Tax Assessment Total Assessment is a certain percentage of the fair market value that is determined by local assessors to be the total taxable value of land and additions on the property. | Land | Improvement |
|---|---|---|---|---|
| 2025 | $7,162 | $360,200 | $195,000 | $165,200 |
| 2024 | $7,162 | $334,200 | $185,000 | $149,200 |
| 2023 | $5,647 | $262,300 | $145,000 | $117,300 |
| 2022 | $5,426 | $243,000 | $125,000 | $118,000 |
| 2021 | $5,137 | $218,800 | $100,000 | $118,800 |
| 2020 | $5,092 | $213,600 | $90,000 | $123,600 |
| 2019 | $5,154 | $214,400 | $90,000 | $124,400 |
| 2018 | $5,029 | $207,900 | $80,000 | $127,900 |
| 2017 | $4,912 | $203,400 | $80,000 | $123,400 |
| 2016 | $4,929 | $204,200 | $80,000 | $124,200 |
| 2015 | $5,352 | $224,500 | $80,000 | $144,500 |
| 2014 | $5,259 | $225,300 | $80,000 | $145,300 |
Source: Public Records
Map
Nearby Homes
- 104 Devonshire Ct
- 911 Merritt Dr Unit B2
- 912 Merritt Dr Unit D
- 303 Gemini Dr Unit 2B
- 902 Merritt Dr Unit E
- 68 Dunedain St
- 710 Whitenack Ct
- 118 Bluebird Dr Unit 3
- 107 Bluebird Dr Unit 1D
- 3120 Revere Ct
- 911 Renate Dr Unit 1
- 3014 Revere Ct
- 3011 Revere Ct
- 3204 Revere Ct
- 3007 Revere Ct
- 195 Beekman Ln
- 7 Monfort Dr
- 3320 Richmond Ct
- 790 Eves Dr
- 807 Eves Dr Unit 1B
- 105 Devonshire Ct
- 107 Devonshire Ct
- 108 Devonshire Ct
- 103 Devonshire Ct
- 102 Devonshire Ct
- 111 Devonshire Ct
- 101 Devonshire Ct
- 112 Devonshire Ct Unit 112
- 113 Devonshire Ct
- 98 Devonshire Ct
- 97 Devonshire Ct
- 114 Devonshire Ct
- 115 Devonshire Ct
- 96 Devonshire Ct
- 95 Devonshire Ct
- 116 Devonshire Ct
- 117 Devonshire Ct
- 94 Devonshire Ct Unit 94
- 118 Devonshire Ct
- 93 Devonshire Ct