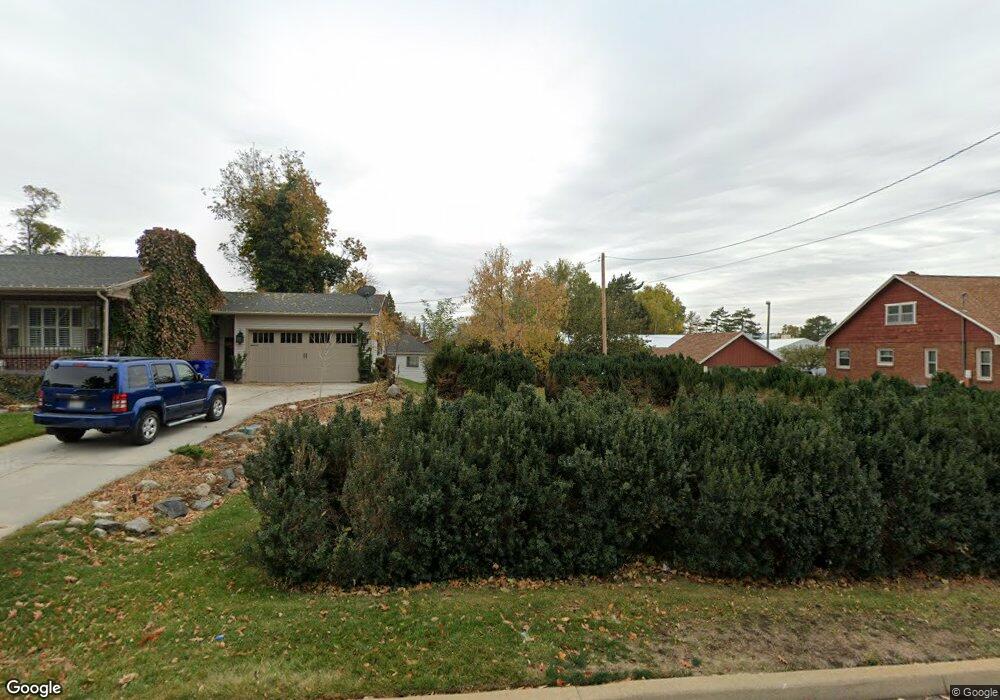
106 E 300 S Bountiful, UT 84010
Estimated Value: $615,000 - $832,543
2
Beds
1
Bath
1,535
Sq Ft
$463/Sq Ft
Est. Value
About This Home
This home is located at 106 E 300 S, Bountiful, UT 84010 and is currently estimated at $710,386, approximately $462 per square foot. 106 E 300 S is a home located in Davis County with nearby schools including Holbrook Elementary School, Millcreek Junior High School, and Bountiful High School.
Ownership History
Date
Name
Owned For
Owner Type
Purchase Details
Closed on
Feb 25, 2019
Sold by
Blackwell Brandon and Fuhriman Mark
Bought by
Blackwell Brandon and Blackwell Sidney
Current Estimated Value
Home Financials for this Owner
Home Financials are based on the most recent Mortgage that was taken out on this home.
Original Mortgage
$500,000
Outstanding Balance
$438,693
Interest Rate
4.4%
Mortgage Type
Commercial
Estimated Equity
$271,693
Purchase Details
Closed on
Jan 31, 2019
Sold by
Renovestors Llc
Bought by
Balckwell Brandon and Fuhrman Mark
Home Financials for this Owner
Home Financials are based on the most recent Mortgage that was taken out on this home.
Original Mortgage
$500,000
Outstanding Balance
$438,693
Interest Rate
4.4%
Mortgage Type
Commercial
Estimated Equity
$271,693
Purchase Details
Closed on
May 18, 2018
Sold by
Babbel Margaret T
Bought by
Renovestors Llc
Home Financials for this Owner
Home Financials are based on the most recent Mortgage that was taken out on this home.
Original Mortgage
$179,685
Interest Rate
4.4%
Mortgage Type
FHA
Create a Home Valuation Report for This Property
The Home Valuation Report is an in-depth analysis detailing your home's value as well as a comparison with similar homes in the area
Purchase History
| Date | Buyer | Sale Price | Title Company |
|---|---|---|---|
| Blackwell Brandon | -- | Gt Title Services | |
| Balckwell Brandon | -- | Inwest Title Services Inc | |
| Renovestors Llc | -- | Backman Title |
Source: Public Records
Mortgage History
| Date | Status | Borrower | Loan Amount |
|---|---|---|---|
| Open | Blackwell Brandon | $500,000 | |
| Previous Owner | Renovestors Llc | $179,685 |
Source: Public Records
Tax History
| Year | Tax Paid | Tax Assessment Tax Assessment Total Assessment is a certain percentage of the fair market value that is determined by local assessors to be the total taxable value of land and additions on the property. | Land | Improvement |
|---|---|---|---|---|
| 2025 | $4,696 | $436,150 | $135,830 | $300,320 |
| 2024 | $4,339 | $414,700 | $124,539 | $290,161 |
| 2023 | $4,370 | $759,000 | $226,182 | $532,818 |
| 2022 | $4,557 | $434,500 | $122,724 | $311,776 |
| 2021 | $4,294 | $628,000 | $160,737 | $467,263 |
| 2020 | $3,996 | $559,000 | $136,132 | $422,868 |
| 2019 | $1,724 | $192,000 | $136,040 | $55,960 |
| 2018 | $1,784 | $210,000 | $133,181 | $76,819 |
| 2016 | $1,549 | $98,725 | $57,518 | $41,207 |
| 2015 | $1,503 | $89,815 | $57,518 | $32,297 |
| 2014 | $1,443 | $89,537 | $57,518 | $32,019 |
| 2013 | -- | $88,097 | $42,122 | $45,975 |
Source: Public Records
Map
Nearby Homes
- 32 W 400 S
- 34 W 400 S
- 545 S 100 E
- 650 S Main St Unit 9106
- 275 E Peach Ln S
- 520 S Orchard Dr Unit 17
- 337 Peach Ln
- 323 Peach Ln
- 55 E 200 N Unit 2
- 51 E 200 N Unit 3
- 49 E 200 N Unit 4
- 41 E 200 N Unit 6
- 254 N Main St
- 256 N Main St
- 252 N Main St
- 109 W 900 S
- 345 N 400 E
- 75 N Peregrine Ln W Unit 8
- 320 N 200 W Unit 4
- 453 N 400 E Unit 7-D
Your Personal Tour Guide
Ask me questions while you tour the home.